

Technical analysis
Cotton Wave Analysis – 11 February, 2020
February 11, 2020 @ 17:22 +03:00

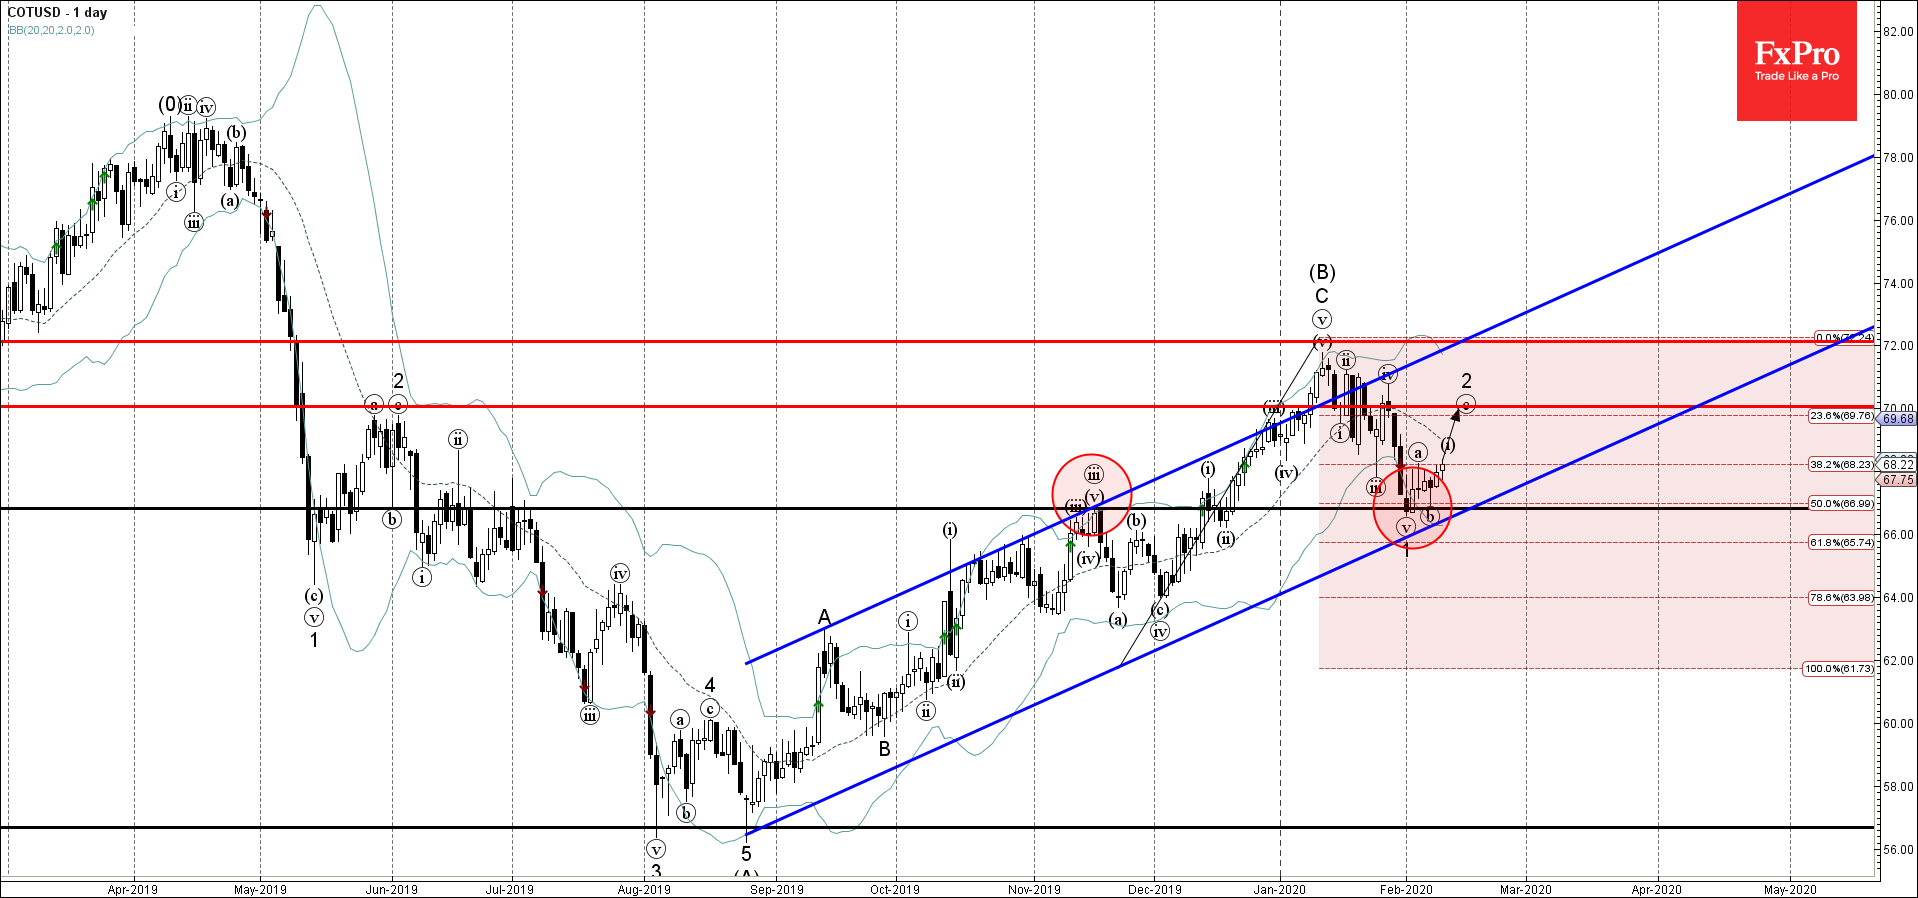
- Cotton reversed from support area
- Likely to rise to resistance level 70.00
Cotton recently reversed up from the support zone located between the pivotal support level 66.80 (former resistance from November), support trendline of the daily up channel from August, lower daily Bollinger Band and the 50% Fibonacci correction of the earlier upward impulse from November.
The upward reversal from this support area started the active short-term ABC correction 2.
Cotton is likely to rise further toward the next resistance level 70.00 (target price for the completion of the active wave 2).
Related Articles

EURJPY Wave Analysis 18 April 2024
April 18, 2024 @ 23:09 +03:00

EURUSD Wave Analysis 18 April 2024
April 18, 2024 @ 23:08 +03:00

WTI Wave Analysis 17 April 2024
April 17, 2024 @ 22:40 +03:00

EURGBP Wave Analysis 17 April 2024
April 17, 2024 @ 22:38 +03:00