

Technical analysis
Corn Wave Analysis – 13 February, 2019
February 13, 2019 @ 18:07 +03:00

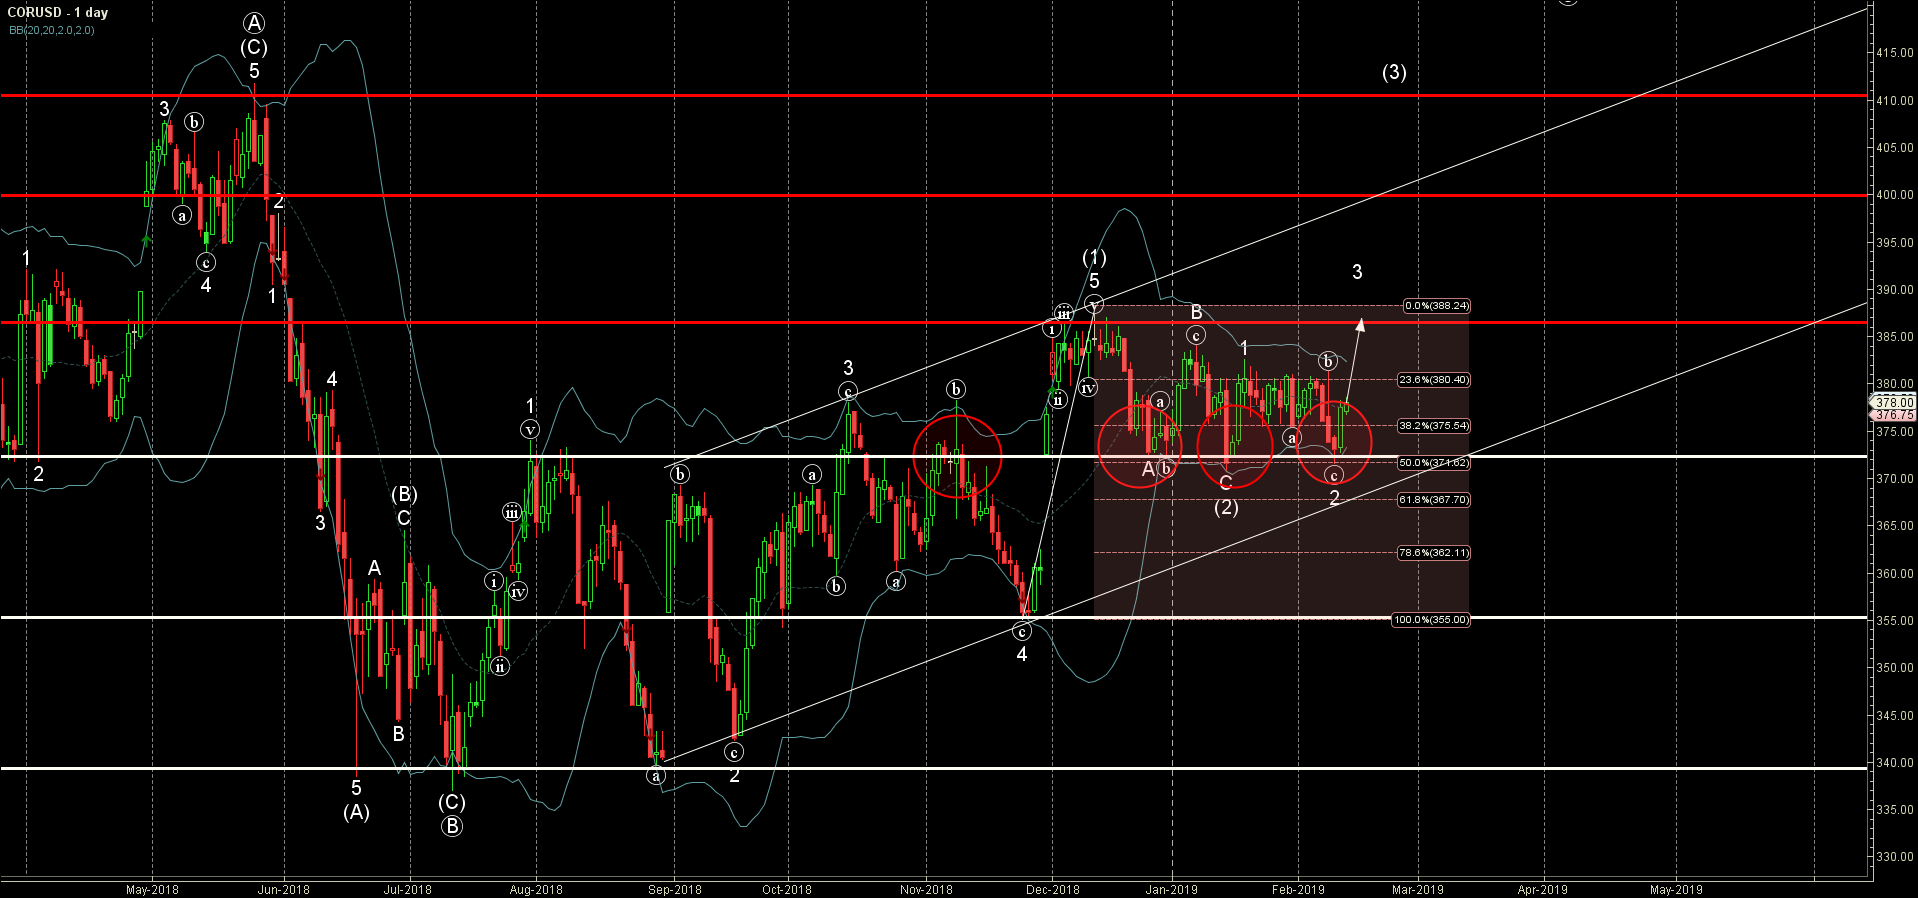
- Corn reversed from support area
- Further gains are likely
Corn recently reversed up from the support area lying between the key support level 372.00 (which has been reversing the price from the end of December), lower daily Bollinger Band and the 50% Fibonacci correction of the previous sharp upward impulse from November.
The upward reversal from this support area created the daily Japanese candlesticks reversal pattern Morning Star.
Corn is expected to rise further and re-test the next resistance level 385.00 (monthly high from December).
 CORUSD
Related Articles

USDJPY Wave Analysis 26 April 2024
April 27, 2024 @ 00:00 +03:00

Ebay Wave Analysis 26 April 2024
April 26, 2024 @ 23:59 +03:00

GBPCAD Wave Analysis 25 April 2024
April 25, 2024 @ 20:10 +03:00

GBPAUD Wave Analysis 25 April 2024
April 25, 2024 @ 20:09 +03:00