

Technical analysis
Copper Wave Analysis – 27 September , 2018
September 27, 2018 @ 19:35 +03:00
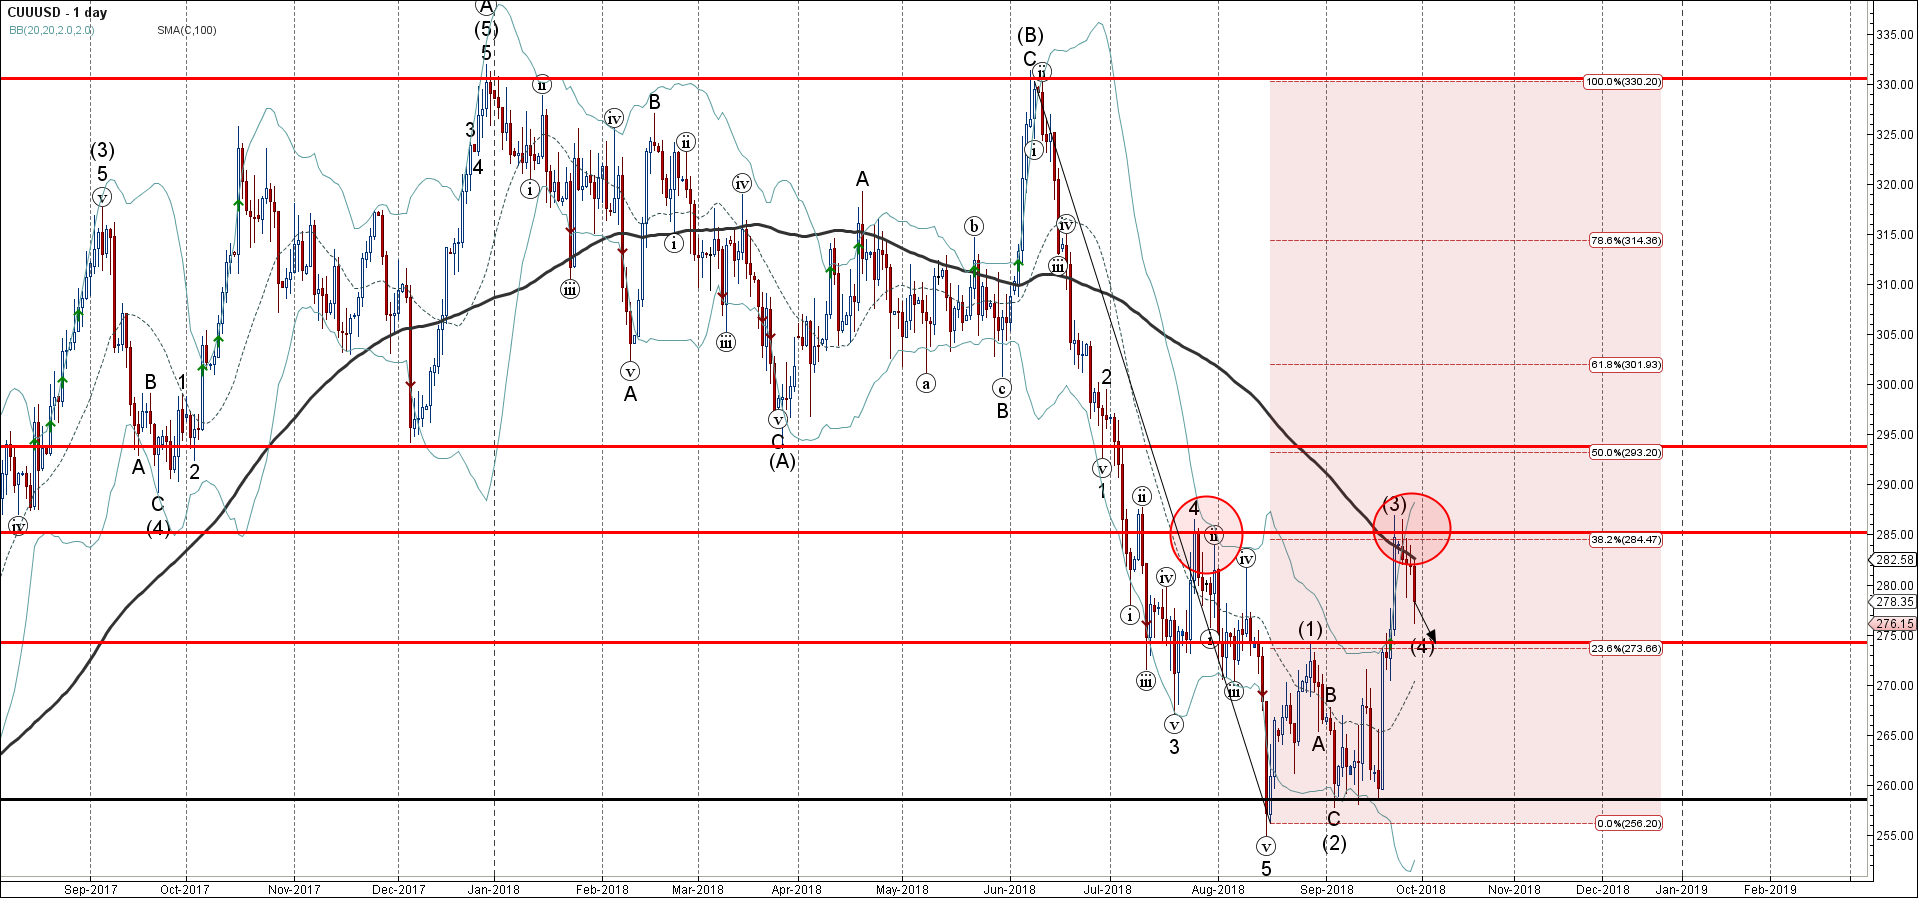
- Copper reversed from resistance area
- Copper losses are likely
Copper recently reversed down from the resistance area lying between the resistance level 285.00 (top of wave 4 from July), upper daily Bollinger Band, 100-day moving average and the 38.2% Fibonacci correction of the previous downer impulse from June.
The downward reversal from this resistance area started the active short-term corrective wave (4).
Copper is expected fall further and retest the next support level 275.00 (forecast price for the completion of the active correction (4).
Related Articles

EURJPY Wave Analysis 18 April 2024
April 18, 2024 @ 23:09 +03:00

EURUSD Wave Analysis 18 April 2024
April 18, 2024 @ 23:08 +03:00

WTI Wave Analysis 17 April 2024
April 17, 2024 @ 22:40 +03:00

EURGBP Wave Analysis 17 April 2024
April 17, 2024 @ 22:38 +03:00