

Technical analysis
Copper Wave Analysis – 23 July, 2020
July 23, 2020 @ 17:55 +03:00

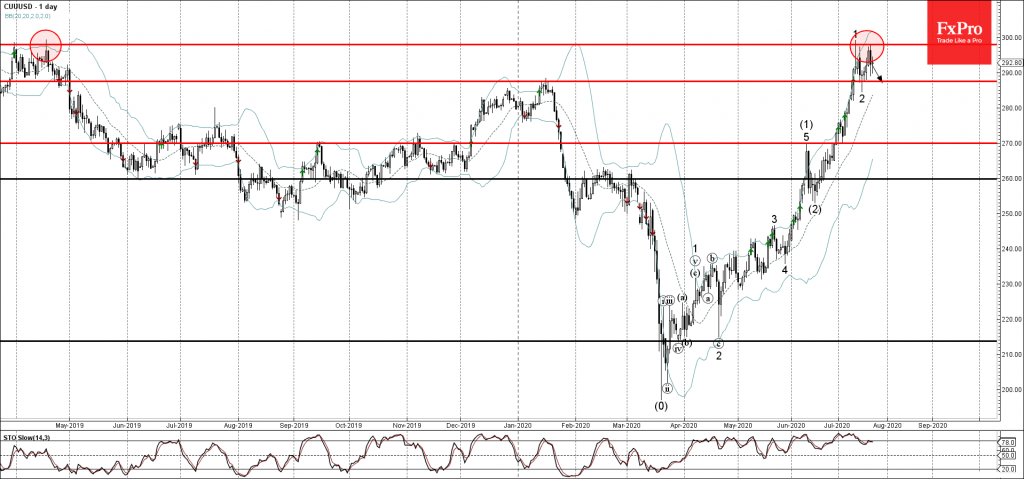
• Copper reversed from long-term resistance level 298.00
• Likely to fall to 287.50
Copper recently reversed down from the long-term resistance level 298.00 (which has been steadily reversing the price from the middle of 2019, as can be seen from the daily Copper chart below).
The downward reversal from the resistance level 298.00 created the daily Japanese candlesticks reversal pattern Bearish Engulfing.
Copper is likely to correct down further toward the next support level 287.50 (former multi-month resistance level from the start of 2020).
Related Articles

GBPCAD Wave Analysis 25 April 2024
April 25, 2024 @ 20:10 +03:00

GBPAUD Wave Analysis 25 April 2024
April 25, 2024 @ 20:09 +03:00

EURGBP Wave Analysis 24 April 2024
April 24, 2024 @ 21:42 +03:00

EURJPY Wave Analysis 24 April 2024
April 24, 2024 @ 21:40 +03:00