

Technical analysis
Citigroup Wave Analysis – 12 March, 2020
March 12, 2020 @ 17:54 +03:00
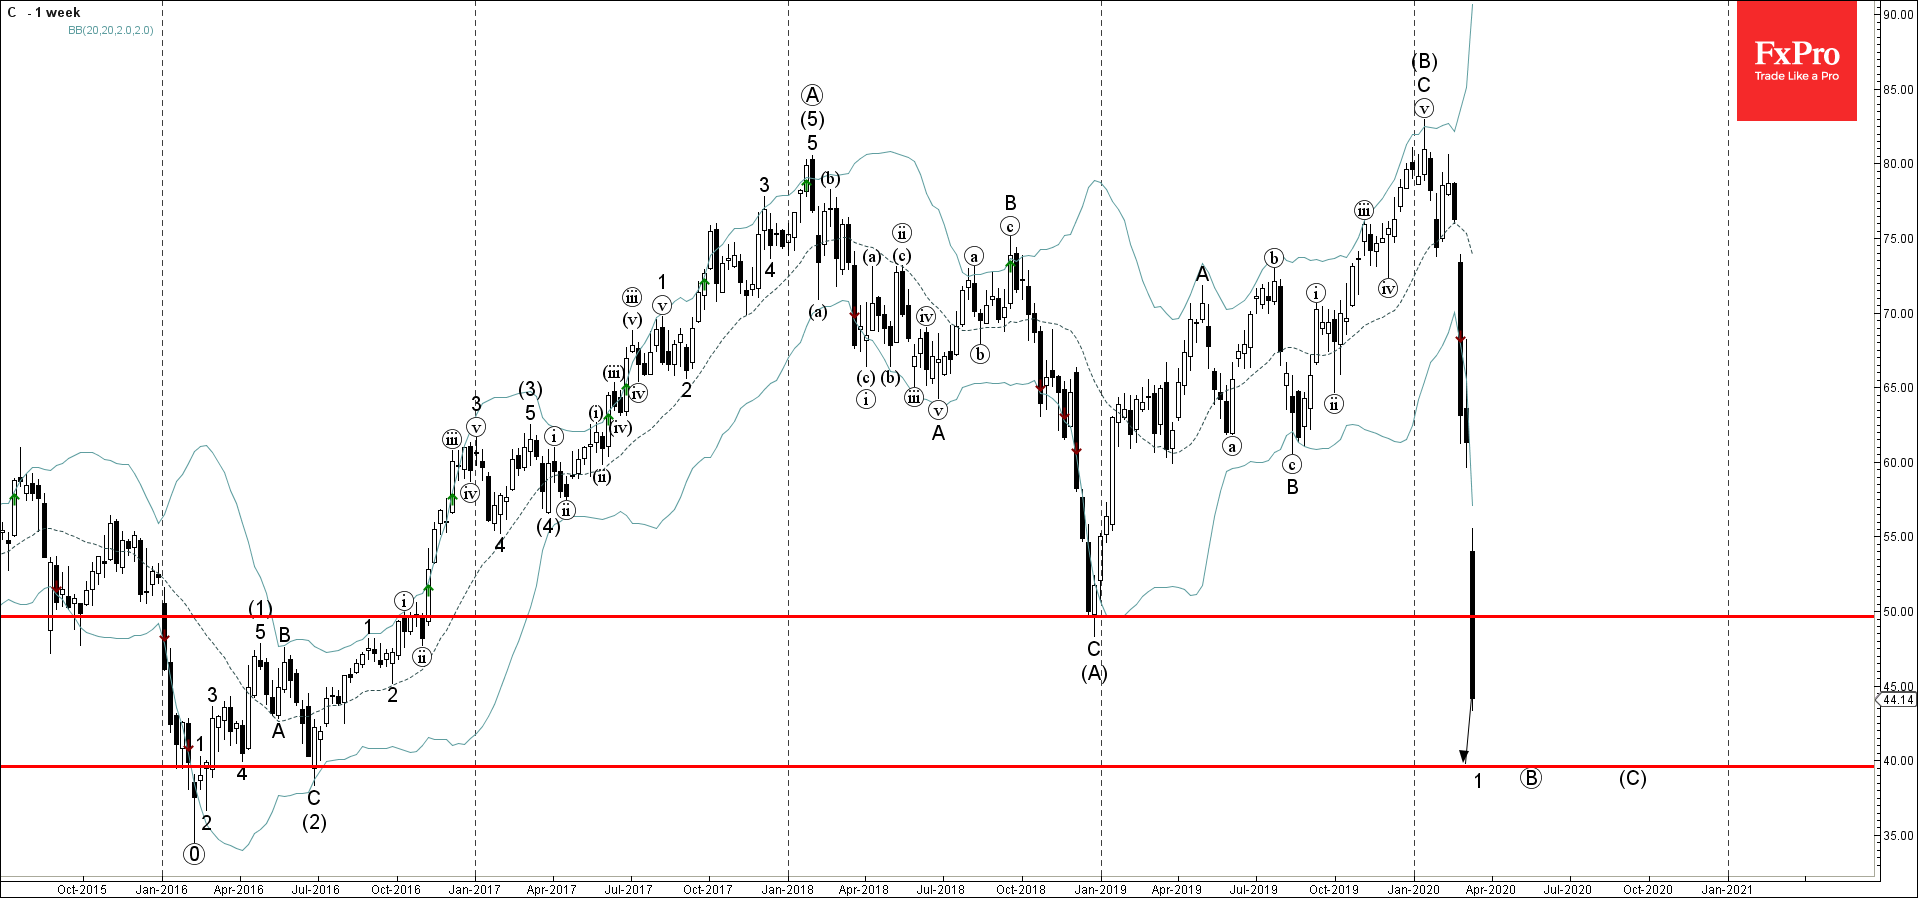
- Citigroup broke long-term support level 50.00
- Likely to fall to 40.00
Citigroup recently broke the major long-term support level 50.00 (which stopped the earlier weekly downtrend at the end of 201 as can be seen from the weekly Citigroup chart below).
The breakout of the support level 50.00 continues the active weekly downward impulse wave (C) – which started earlier from the major resistance level 80.00.
Citigroup is likely to fall further toward the next round support level 40.00 (former support from the middle of 2016 and the likely price for the completion of the active impulse wave (C)).
Related Articles

GBPCAD Wave Analysis 25 April 2024
April 25, 2024 @ 20:10 +03:00

GBPAUD Wave Analysis 25 April 2024
April 25, 2024 @ 20:09 +03:00

EURGBP Wave Analysis 24 April 2024
April 24, 2024 @ 21:42 +03:00

EURJPY Wave Analysis 24 April 2024
April 24, 2024 @ 21:40 +03:00