

Technical analysis
CADJPY Wave Analysis – 10 July, 2020
July 10, 2020 @ 17:05 +03:00

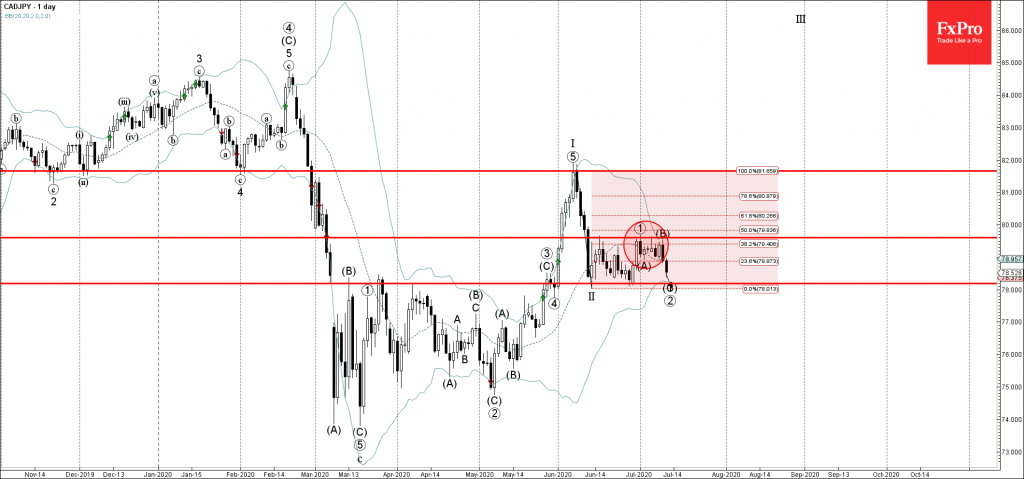
• CADJPY reversed from resistance area
• Likely to fall to 78.20
CADJPY recently reversed down with the daily Bearish Engulfing from the resistance area lying between the resistance level 79.60, upper daily Bollinger band and the 38.2% Fibonacci correction of the downward impulse from June.
The downward reversal from this resistance area started the active impulse wave (C).
CADJPY is likely to fall further toward the next support level 78.20 (lower boundary of the narrow price range inside which the pair has been trading from the middle of June).
Related Articles

Intel Wave Analysis 19 April 2024
April 19, 2024 @ 22:12 +03:00

GBPUSD Wave Analysis 19 April 2024
April 19, 2024 @ 22:11 +03:00

EURJPY Wave Analysis 18 April 2024
April 18, 2024 @ 23:09 +03:00

EURUSD Wave Analysis 18 April 2024
April 18, 2024 @ 23:08 +03:00