

Technical analysis
CADCHF Wave Analysis – 25 June, 2019
June 25, 2019 @ 15:23 +03:00

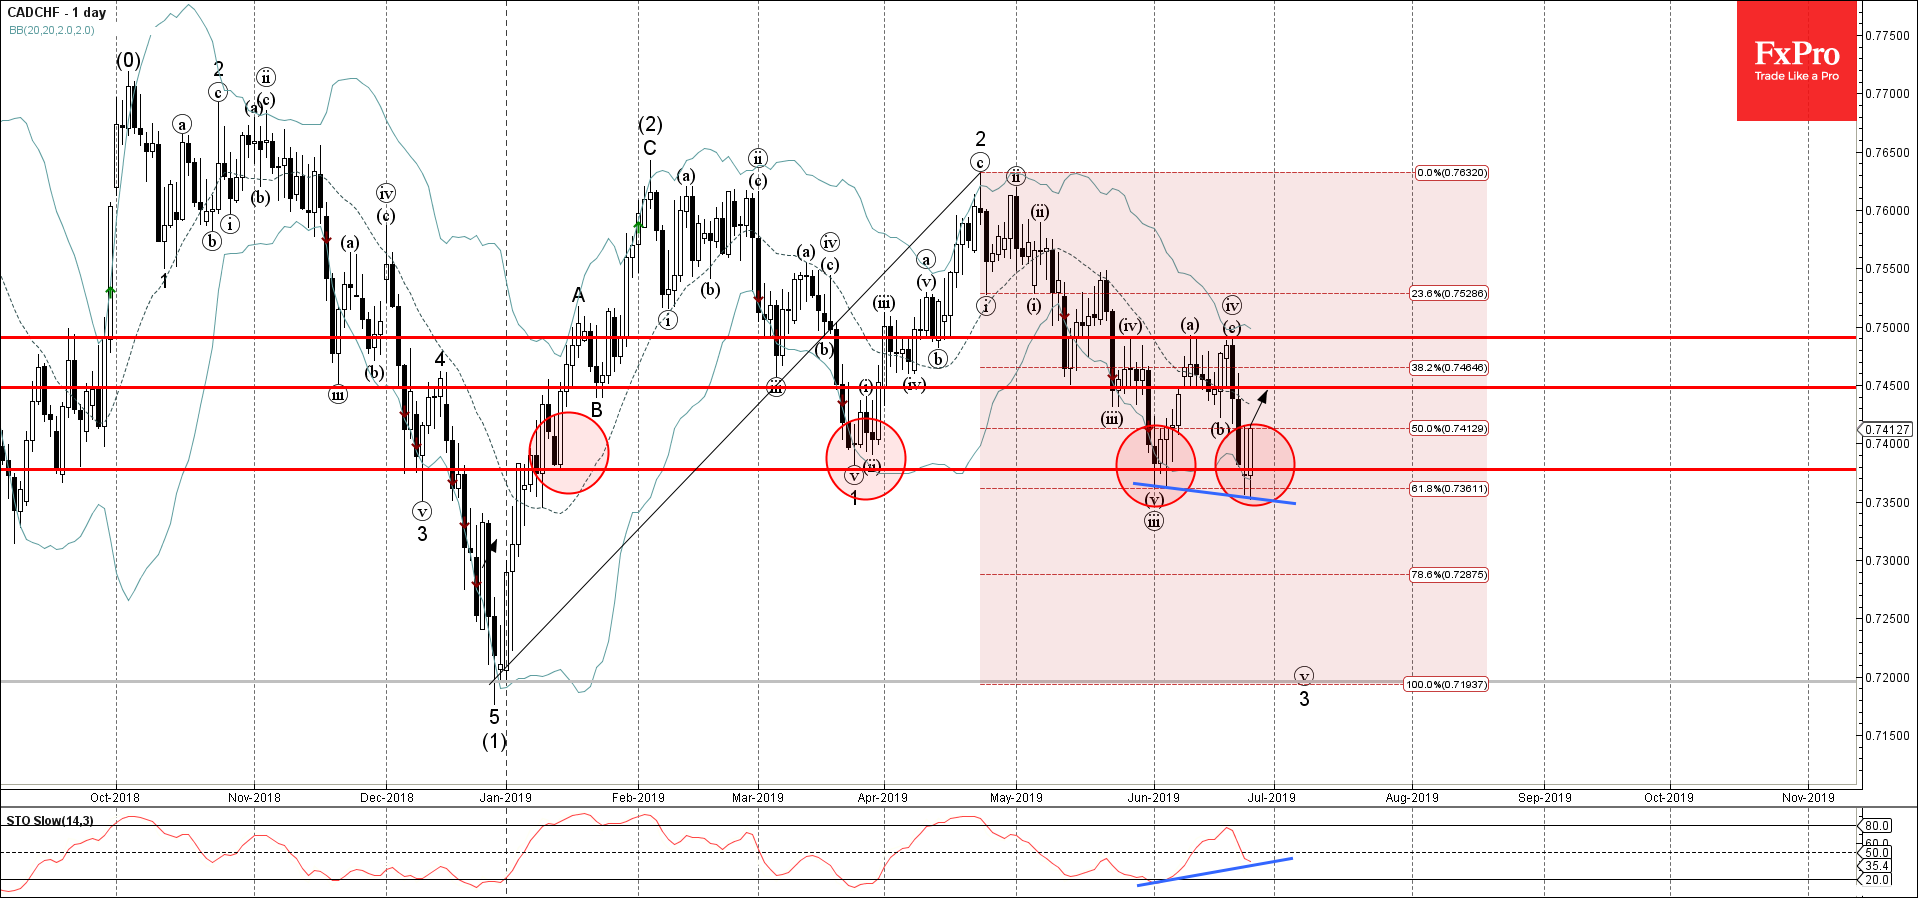
- CADCHF reversed from support area
- Further gains are likely
CADCHF recently reversed up sharply from the support area lying between the multi-month support level 0.7380 (which has been reversing the price from January), 61.8% Fibonacci correction of the upward move from December and the lower daily Bollinger Band.
The upward reversal from this support area stopped the active short-term impulse wave 3 from the end of April.
Given the bullish divergence on the daily Stochastic indicator – CADCHF is expected to rise further and retest the next resistance level 0.7450.
Related Articles

EURGBP Wave Analysis 24 April 2024
April 24, 2024 @ 21:42 +03:00

EURJPY Wave Analysis 24 April 2024
April 24, 2024 @ 21:40 +03:00

WTI crude oil Wave Analysis 23 April 2024
April 23, 2024 @ 22:47 +03:00

USDCAD Wave Analysis 23 April 2024
April 23, 2024 @ 22:46 +03:00