

Technical analysis
CADCHF Wave Analysis – 13 March, 2020
March 13, 2020 @ 15:29 +03:00

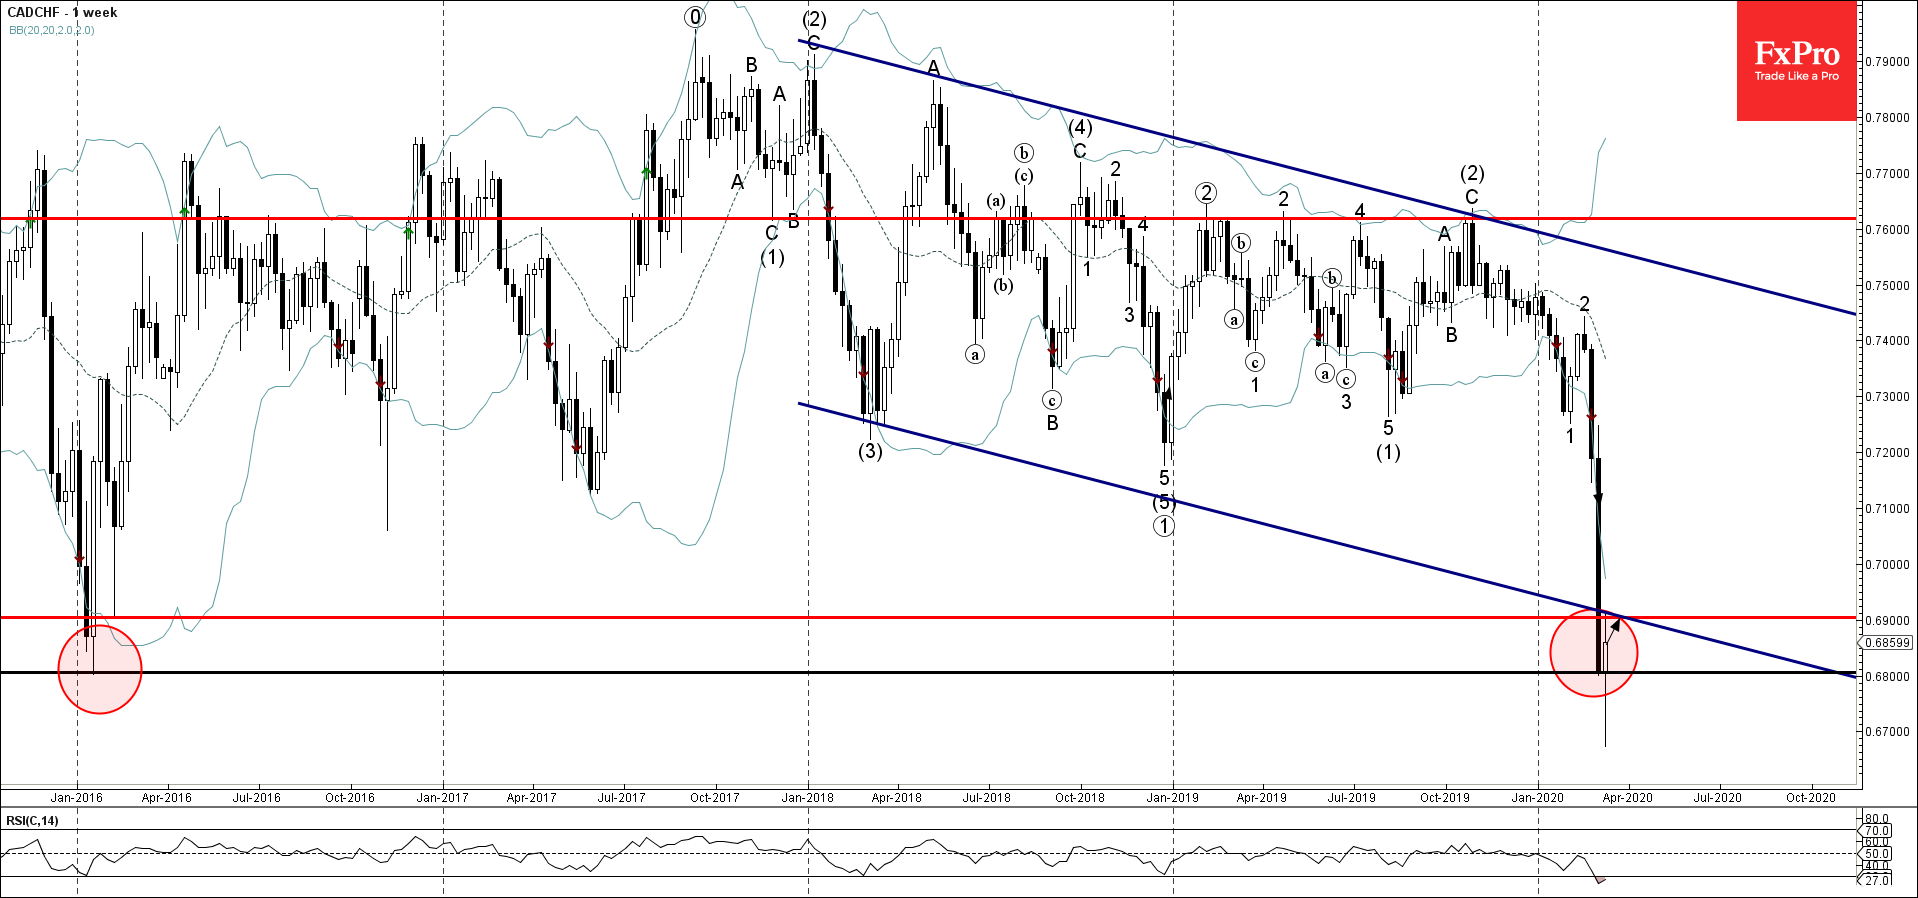
- CADCHF reversed from support area
- Likely to rise to 0.6900
CADCHF recently reversed up strongly from the support area located between the long-term support level 0.6800 (which stopped the previous sharp downtrend at the start of 2016) and the lower weekly Bollinger Band.
The upward reversal from this support area is set to create the weekly Japanese candlesticks reversal pattern Hammer.
With the oversold weekly RSI – CADCHF is likely to rise further toward the next round resistance level 0.6900 (intersecting with the lower trendline of the weekly down channel from the start of 2018).
Related Articles

EURJPY Wave Analysis 18 April 2024
April 18, 2024 @ 23:09 +03:00

EURUSD Wave Analysis 18 April 2024
April 18, 2024 @ 23:08 +03:00

WTI Wave Analysis 17 April 2024
April 17, 2024 @ 22:40 +03:00

EURGBP Wave Analysis 17 April 2024
April 17, 2024 @ 22:38 +03:00