

Technical analysis
Boeing Wave Analysis – 13 January, 2020
January 13, 2020 @ 18:04 +03:00
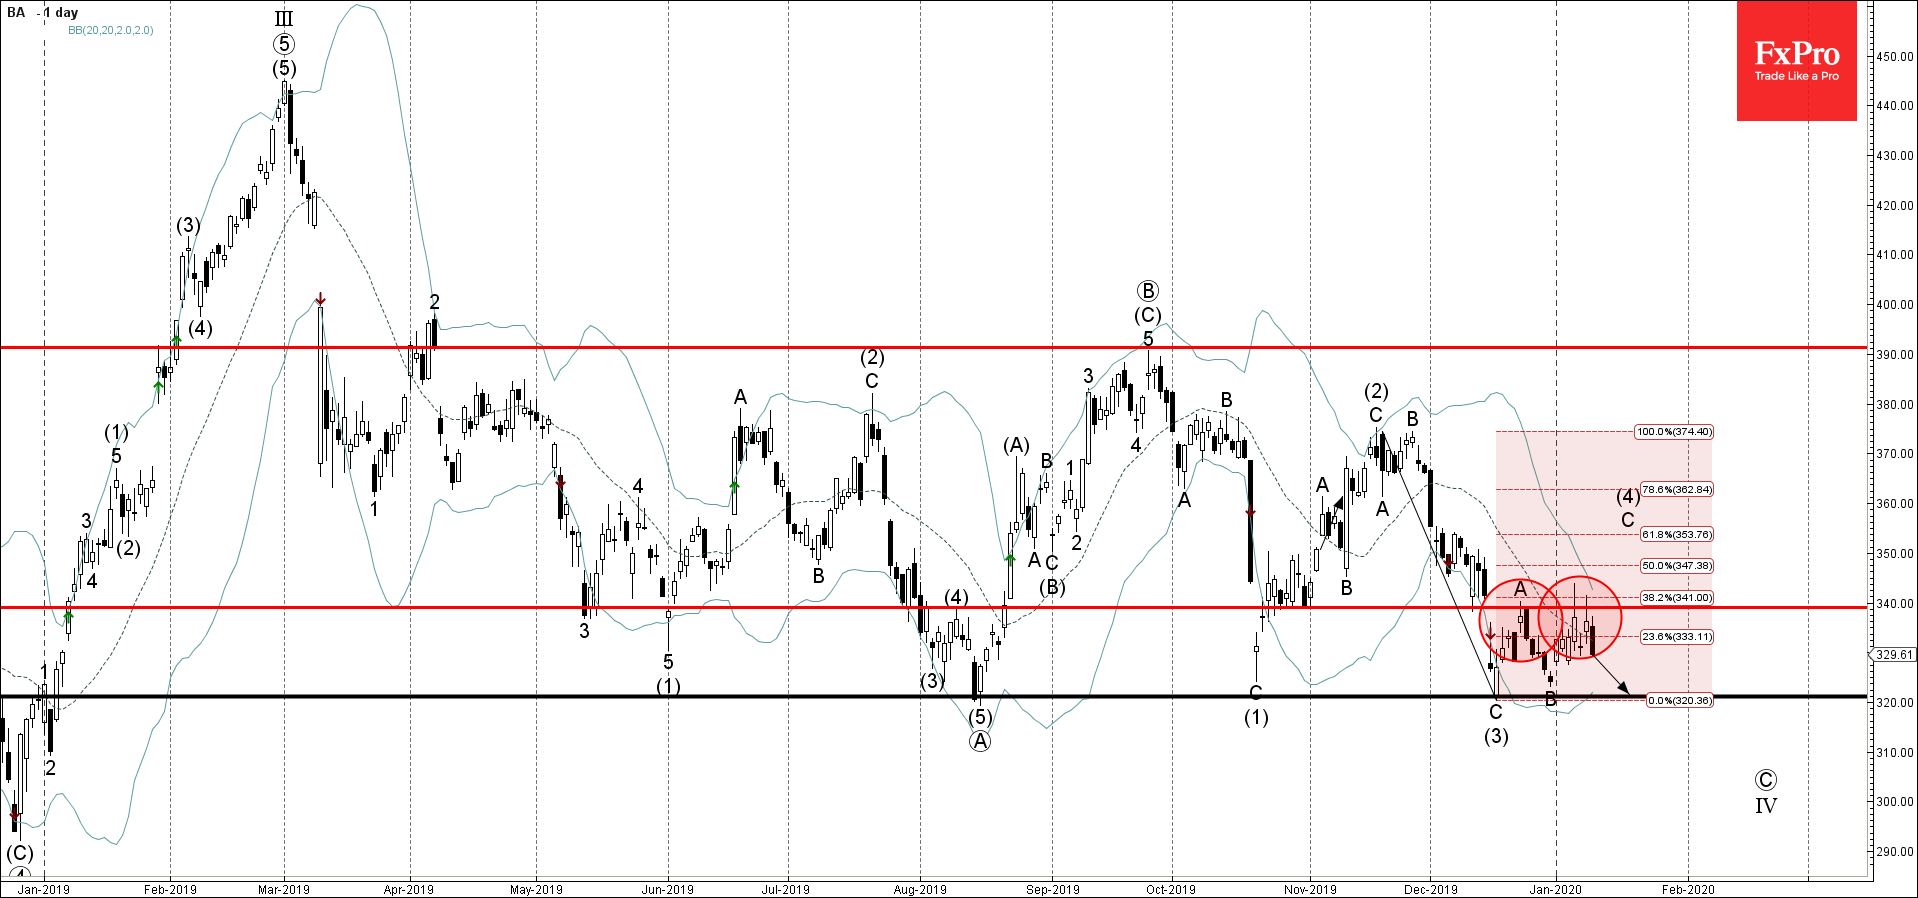
- Boeing reversed from resistance area
- Likely to fall to 321.00
Boeing recently reversed down with the daily Shooting Star from the resistance area lying between the resistance level 340.00 (top of the previous wave A from December), upper daily Bollinger Band and the 38.2% Fibonacci correction of the previous sharp downward impulse wave (3).
The downward reversal from this resistance area stopped the previous short term impulse wave C from the end of December.
Boeing is likely to fall further toward the next powerful support level 321.00 (which has been reversing the price from August).
Related Articles

Intel Wave Analysis 19 April 2024
April 19, 2024 @ 22:12 +03:00

GBPUSD Wave Analysis 19 April 2024
April 19, 2024 @ 22:11 +03:00

EURJPY Wave Analysis 18 April 2024
April 18, 2024 @ 23:09 +03:00

EURUSD Wave Analysis 18 April 2024
April 18, 2024 @ 23:08 +03:00