

Technical analysis
AUS200 Wave Analysis – 26 February, 2020
February 26, 2020 @ 18:11 +03:00

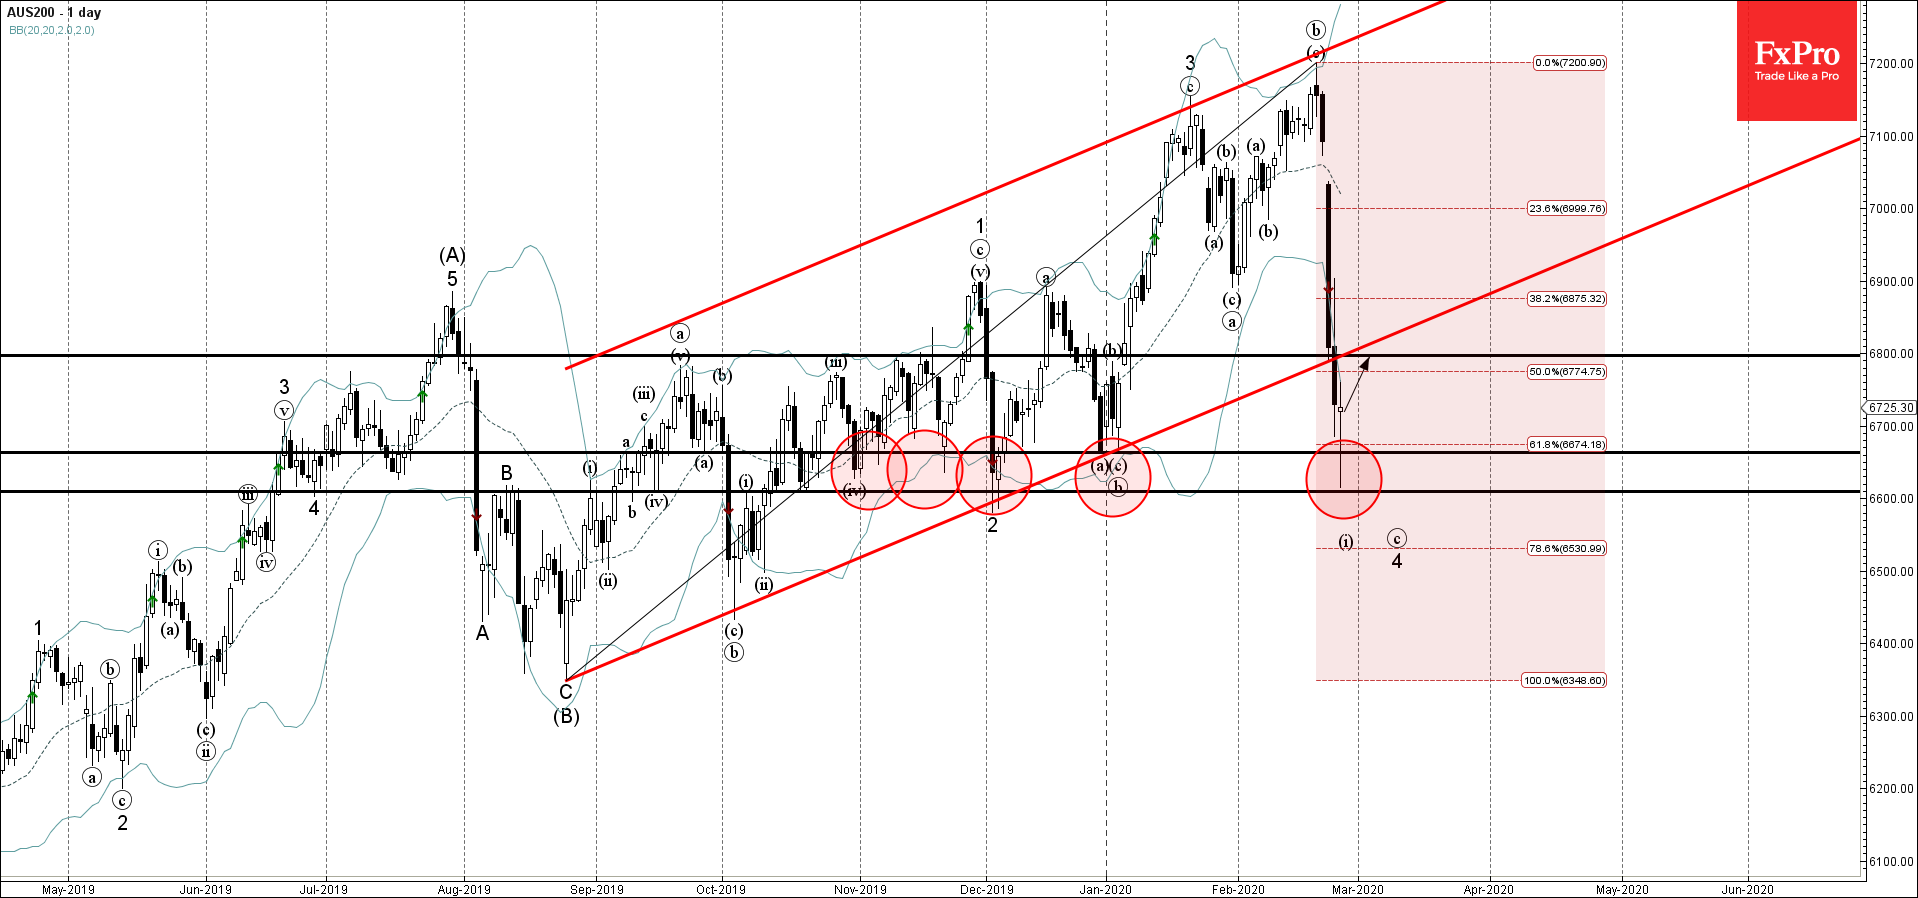
- AUS200 reversed from support area
- Likely to rise to 6800.00
AUS200 recently reversed up sharply from the support area located between the strong support levels 6660.00, 6600.00, lower daily Bollinger Band and 61.8% Fibonacci retracement of the previous upward impulse from August.
The upward reversal from this support area created the daily Japanese candlesticks reversal pattern Hammer.
AUS200 is likely to rise further toward the next resistance level 6800.00 (the breakout price of the previous daily up channel from August of 2019).
Related Articles

EURGBP Wave Analysis 24 April 2024
April 24, 2024 @ 21:42 +03:00

EURJPY Wave Analysis 24 April 2024
April 24, 2024 @ 21:40 +03:00

WTI crude oil Wave Analysis 23 April 2024
April 23, 2024 @ 22:47 +03:00

USDCAD Wave Analysis 23 April 2024
April 23, 2024 @ 22:46 +03:00