

Technical analysis
AUDCHF Wave Analysis – 26 February, 2020
February 26, 2020 @ 18:08 +03:00

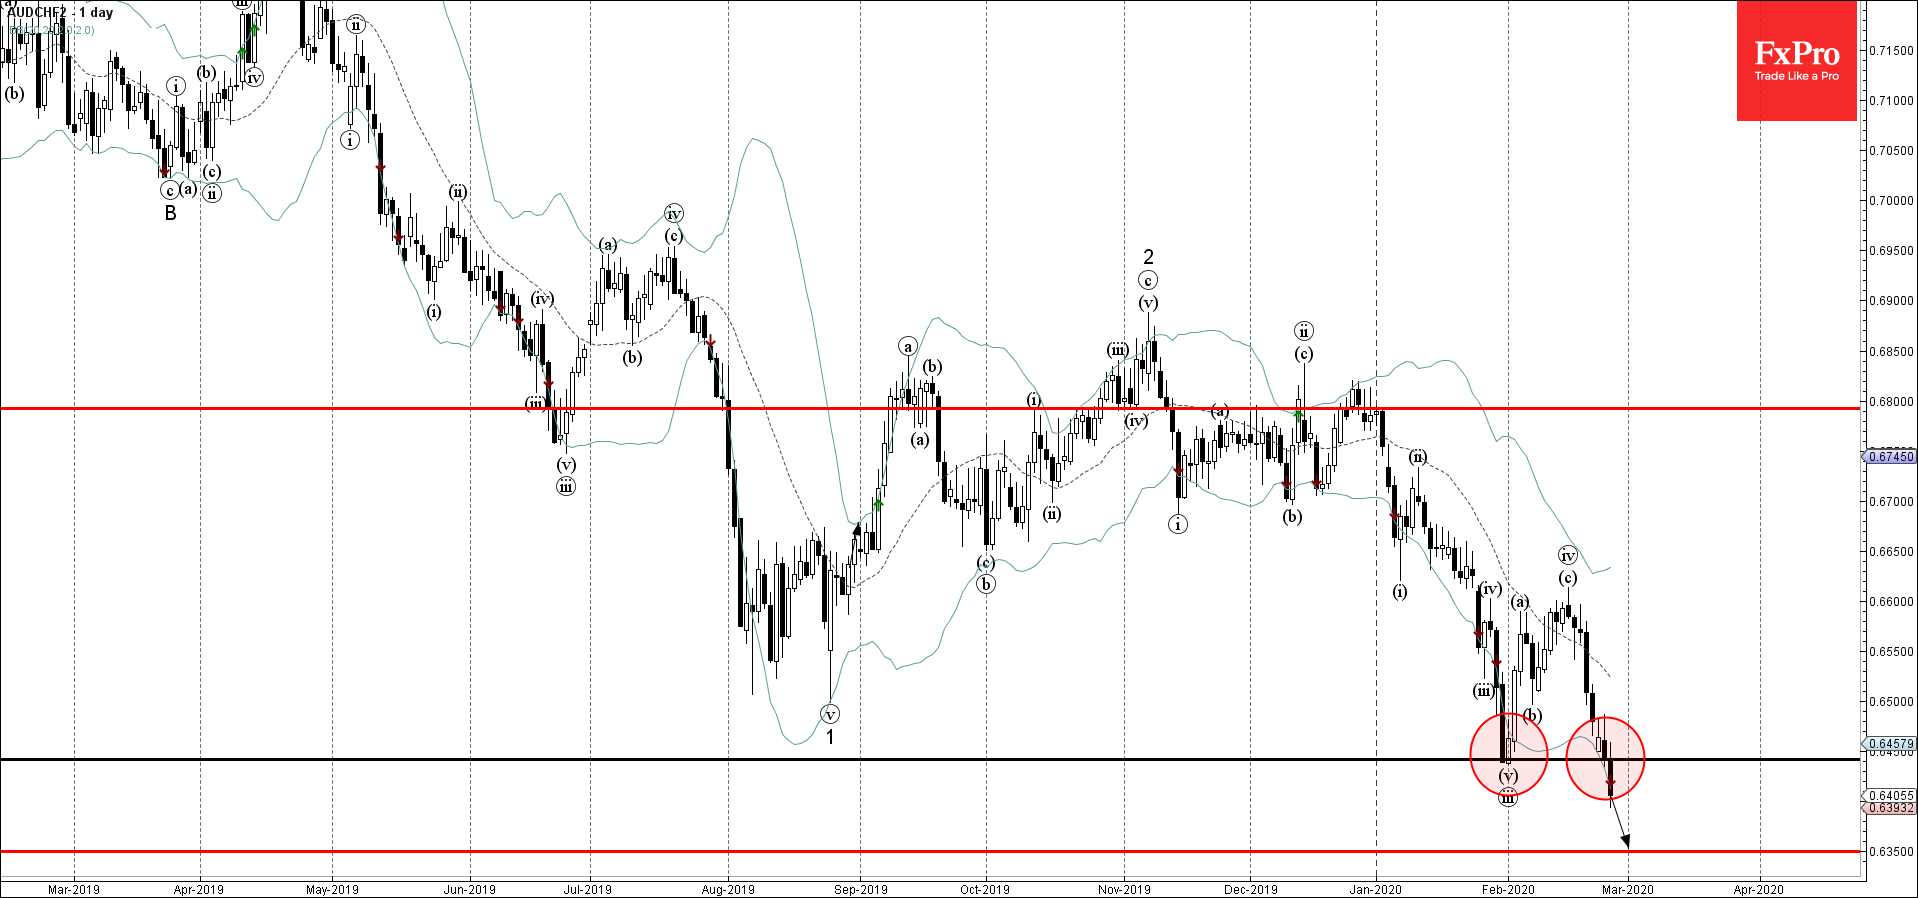
- AUDCHF broke key support level 0.6440
- Likely to fall to 0.6300
AUDCHF recently broke sharply below the key support level 0.6440 (low of the previous Japanese candlesticks pattern Morning Star from the end of January).
The breakout of the support level 0.6440 should accelerate the active short-term impulse wave (v) – which belongs to the multi-month downward impulse sequence 3 from November.
Given the clear downtrend visible on the daily charts – AUDCHF is likely to fall further toward the next support level 0.6300.
Related Articles

EURGBP Wave Analysis 24 April 2024
April 24, 2024 @ 21:42 +03:00

EURJPY Wave Analysis 24 April 2024
April 24, 2024 @ 21:40 +03:00

WTI crude oil Wave Analysis 23 April 2024
April 23, 2024 @ 22:47 +03:00

USDCAD Wave Analysis 23 April 2024
April 23, 2024 @ 22:46 +03:00