

Technical analysis
AUDCAD Wave Analysis – 10 March, 2020
March 10, 2020 @ 17:43 +03:00

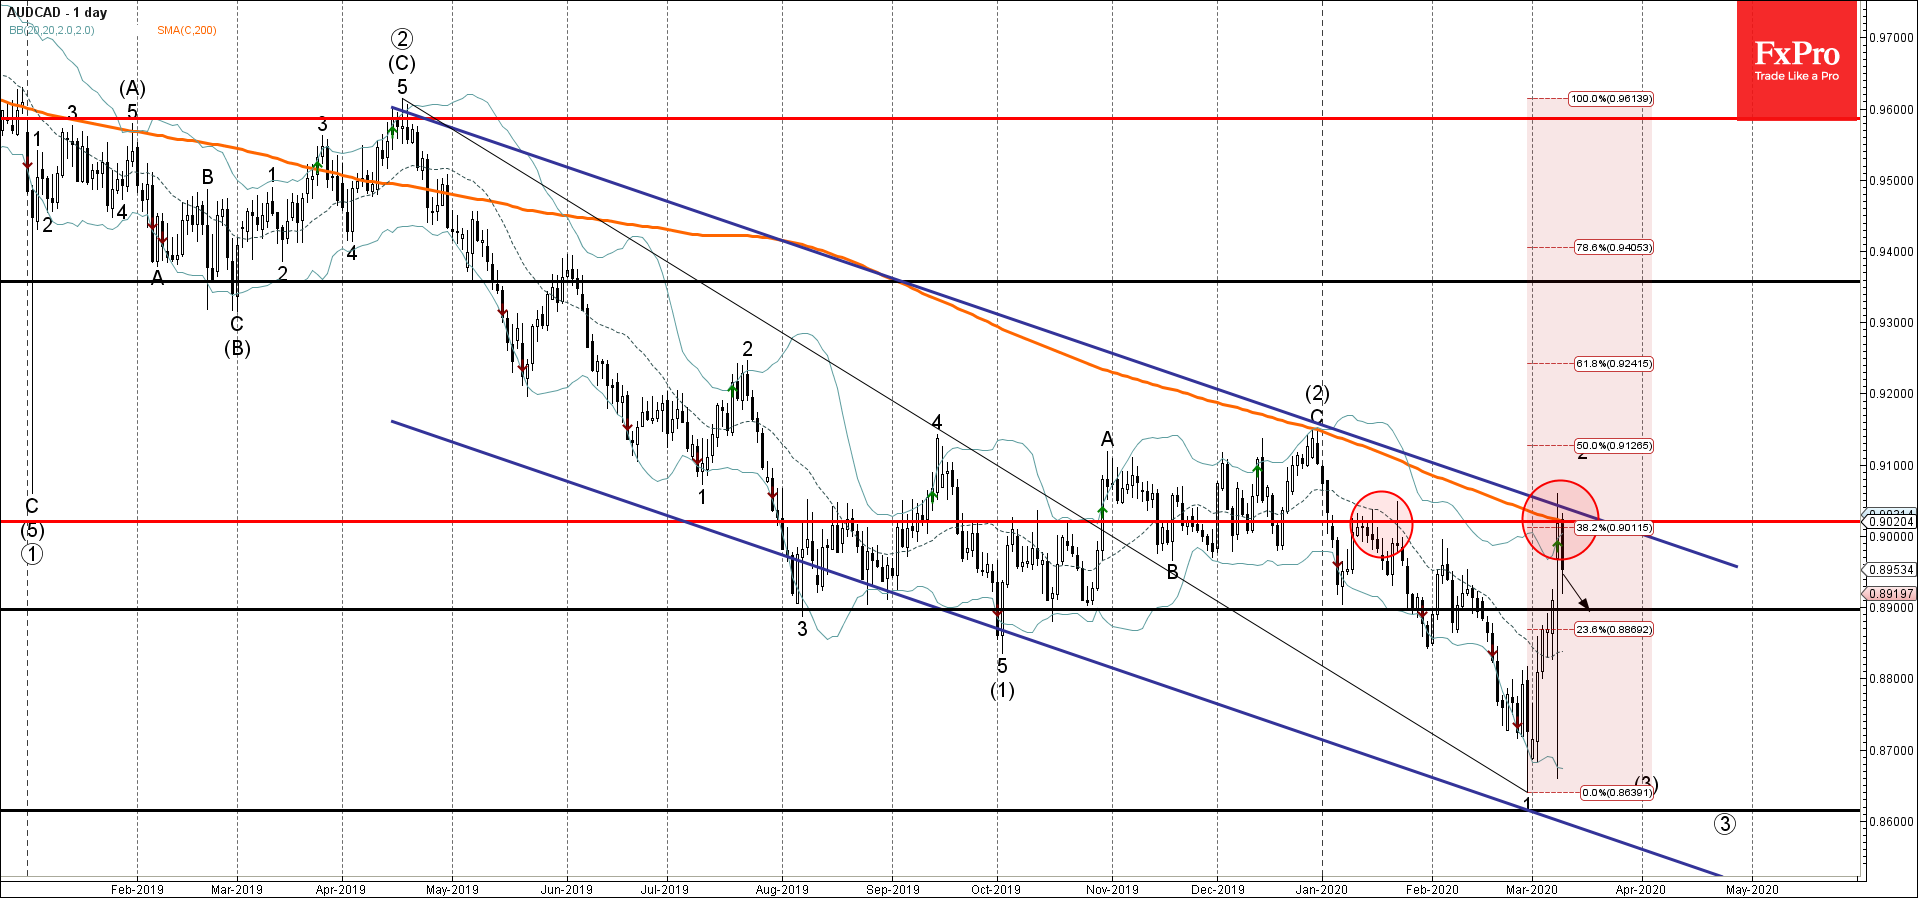
- AUDCAD reversed from resistance area
- Likely to fall to 0.8900
AUDCAD recently reversed down from the resistance zone located between the resistance level 0.9020, upper daily Bollinger Band, resistance trendline of the daily down channel from last April, 200-day moving average and the 38.2% Fibonacci retracement of the previous downward impulse from April.
The downward reversal from this resistance area continues the active medium-term impulse sequence (3) from December.
AUDCAD is likely to fall further toward the next round support level 0.8900 – the breakout of which can lead to further losses toward 0.8800.
Related Articles

Intel Wave Analysis 19 April 2024
April 19, 2024 @ 22:12 +03:00

GBPUSD Wave Analysis 19 April 2024
April 19, 2024 @ 22:11 +03:00

EURJPY Wave Analysis 18 April 2024
April 18, 2024 @ 23:09 +03:00

EURUSD Wave Analysis 18 April 2024
April 18, 2024 @ 23:08 +03:00