

Technical analysis
AIG Wave Analysis – 7 October, 2019
October 07, 2019 @ 16:50 +03:00

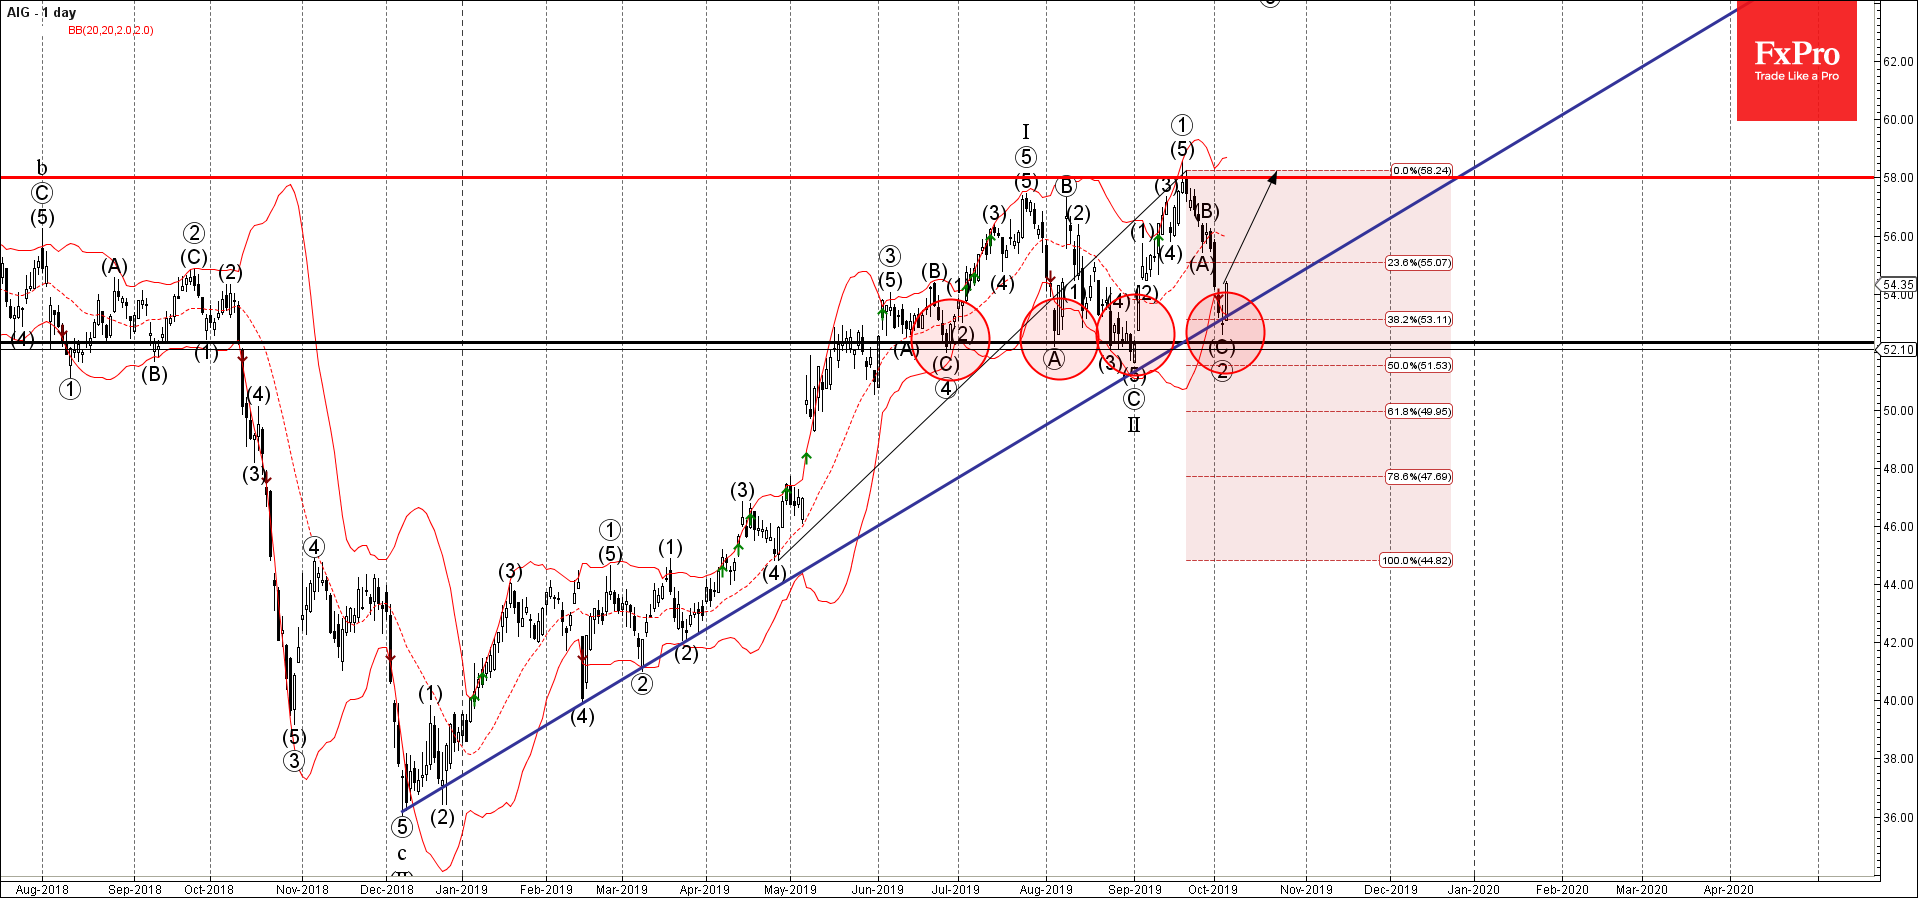
- AIG reversed from support area
- Likely to rise to 58.00
AIG recently reversed up from the support area lying between the strong support level 52.30 (which reversed all downward corrections form June), support trendline from December of 2018 and the lower daily Bollinger Band.
The upward reversal from this support area created the daily Japanese candlesticks reversal pattern Morning Star – standing outside of the lower daily Bollinger Band.
AIG is expected to rise further and retest the next resistance level 58.00 (monthly high and the top of the previous impulse wave (5) from September).
Related Articles

EURJPY Wave Analysis 18 April 2024
April 18, 2024 @ 23:09 +03:00

EURUSD Wave Analysis 18 April 2024
April 18, 2024 @ 23:08 +03:00

WTI Wave Analysis 17 April 2024
April 17, 2024 @ 22:40 +03:00

EURGBP Wave Analysis 17 April 2024
April 17, 2024 @ 22:38 +03:00