

Technical analysis
AIG Wave Analysis – 25 February, 2020
February 25, 2020 @ 15:46 +03:00

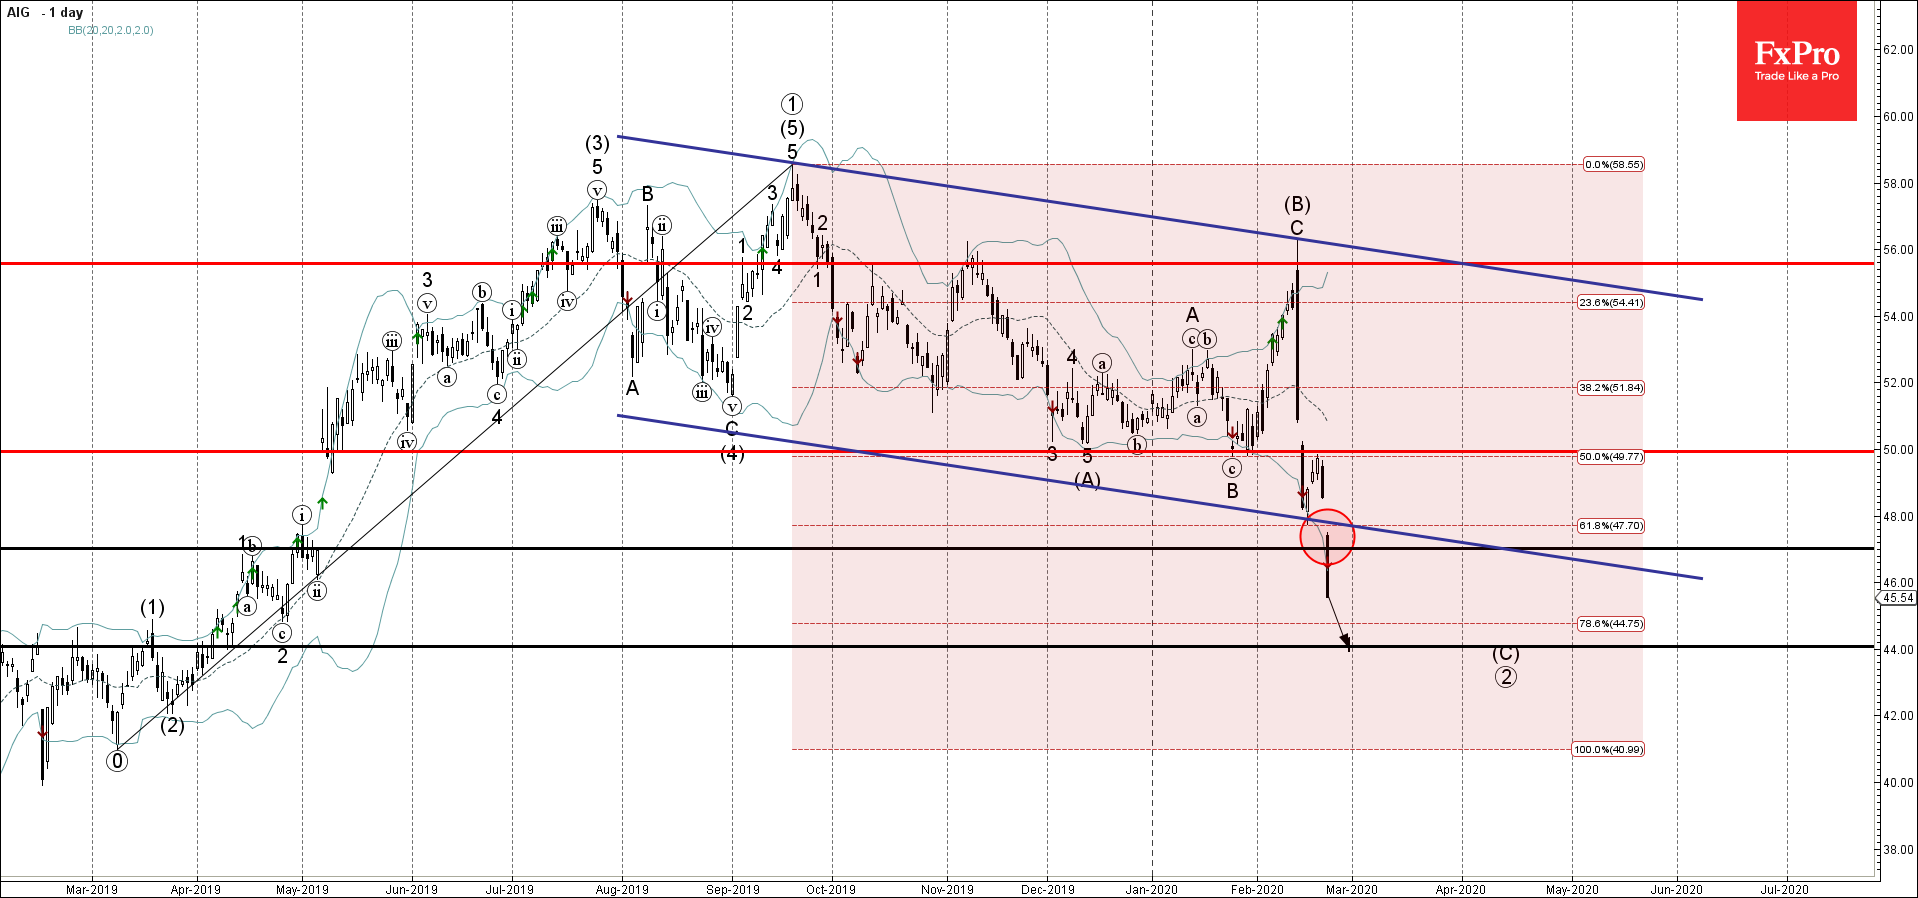
- AIG broke support area
- Likely to fall to 44.00
AIG previously fell sharply breaking through the combined support area located between the support level 47.00, lower trendline of the wide daily down channel from August and the 61.8% Fibonacci correction of the earlier weekly upward impulse wave from March of 2019.
The breakout of this support area should accelerate the C-wave of the multi-month ABC correction (2) from last September.
AIG is likely to fall further toward the next support level 44.00 (former support from April of 2019 and the likely price for the termination of the active C-wave).
Related Articles

EURGBP Wave Analysis 24 April 2024
April 24, 2024 @ 21:42 +03:00

EURJPY Wave Analysis 24 April 2024
April 24, 2024 @ 21:40 +03:00

WTI crude oil Wave Analysis 23 April 2024
April 23, 2024 @ 22:47 +03:00

USDCAD Wave Analysis 23 April 2024
April 23, 2024 @ 22:46 +03:00