

Technical analysis
Adobe Wave Analysis 30 October, 2020
October 30, 2020 @ 18:27 +03:00

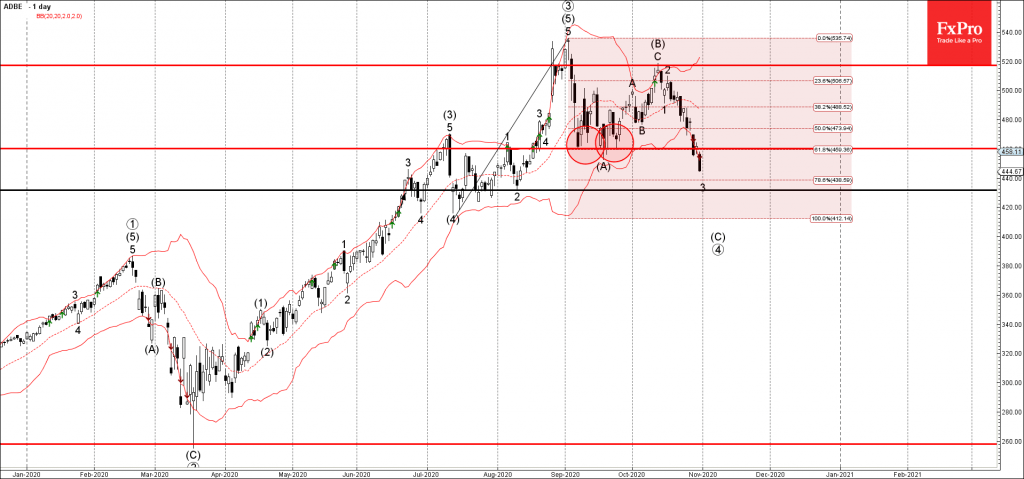
• Adobe broke support zone
• Likely to fall to 431.70
Adobe falling sharply after the earlier breakout of the support zone lying at the intersection of the support level 460.00 (which reversed the price multiple times in September) and the 61.8% Fibonacci correction of the upward impulse from July.
The breakout of this support zone should accelerate the active downward impulse waves 3 and (5).
Adobe is likely to fall further toward the next support level 431.70 (monthly low from August and the target for the completion of the active impulse wave 3).
Related Articles

EURJPY Wave Analysis 18 April 2024
April 18, 2024 @ 23:09 +03:00

EURUSD Wave Analysis 18 April 2024
April 18, 2024 @ 23:08 +03:00

WTI Wave Analysis 17 April 2024
April 17, 2024 @ 22:40 +03:00

EURGBP Wave Analysis 17 April 2024
April 17, 2024 @ 22:38 +03:00