The whole financial world, including the media, is waiting for Nvidia’s quarterly report. The company, which has a market capitalisation of almost $3 trillion, is expected to double its sales compared with last year. It is difficult to beat such expectations, but giving an optimistic revenue forecast for future quarters and years without disappointing investors is even harder.

The size of the company and, more importantly, its impact on a host of other stocks, makes the report, which will be released on Wednesday after the close of the main US session, a hotly anticipated event. Nvidia has managed to please and surprise investors in the past, but it may still need to do so.
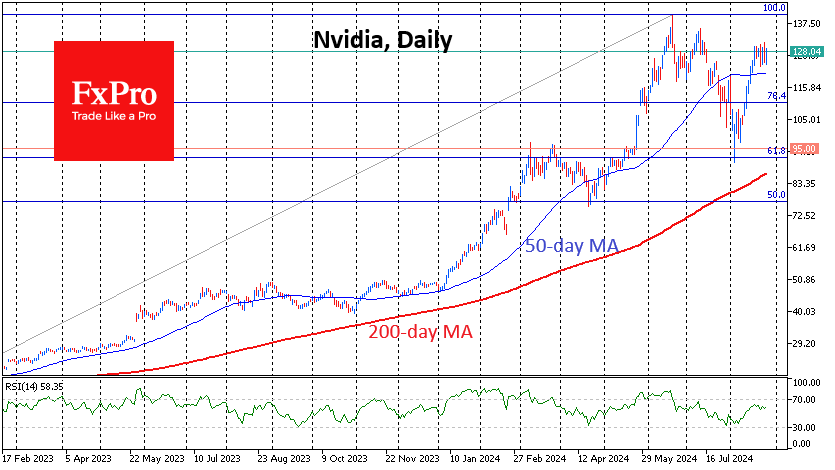
The options market is talking about the prevailing expectation of a 10% change in price after the release, which is in line with the upside amplitude of the previous two reports in May and February, as well as last August. At current prices, this would take the share price to new all-time highs above $141 and the market capitalisation to almost $3.5 trillion, confirming the battle with Apple for the number one spot.
On positive news, the major US equity indices have a good chance of approaching or reaching all-time highs again, shaking off the effects of the carry trade unwinding in late July and early August.
Disappointment with the report could trigger a wave of selloffs in AI-related stocks, which have rallied strongly over the past 20 months. This is likely to spark fresh fears of a repeat of the dot-com crisis of 2000.
A sharp decline could trigger a deeper correction by confirming the divergence between price and RSI on daily timeframes, where a higher price peak corresponds to a lower Relative Strength Index peak. The downside potential in this case will be the $90 area, which would take the price back to this month’s lows and closer to the 200-day moving average.
However, the stock’s exit from its historical highs may not be the end of the move. In this case, a failure in early August would be a typical 61.8% Fibonacci retracement of the global rally from early 2023 to the 20 June high. A break above this would initiate an ‘extension’ with an upside potential of $220.
The FxPro Analyst Team