Wall Street giddyness in recent weeks stands in stark contrast to the pandemic panic of one year ago. U.S. stocks on Tuesday will mark the one-year anniversary of the market low as the spread of the COVID-19 and government lockdowns began to crush economic activity, before massive government and central bank stimulus plus the development of vaccines fueled a stunning, if uneven, rebound.
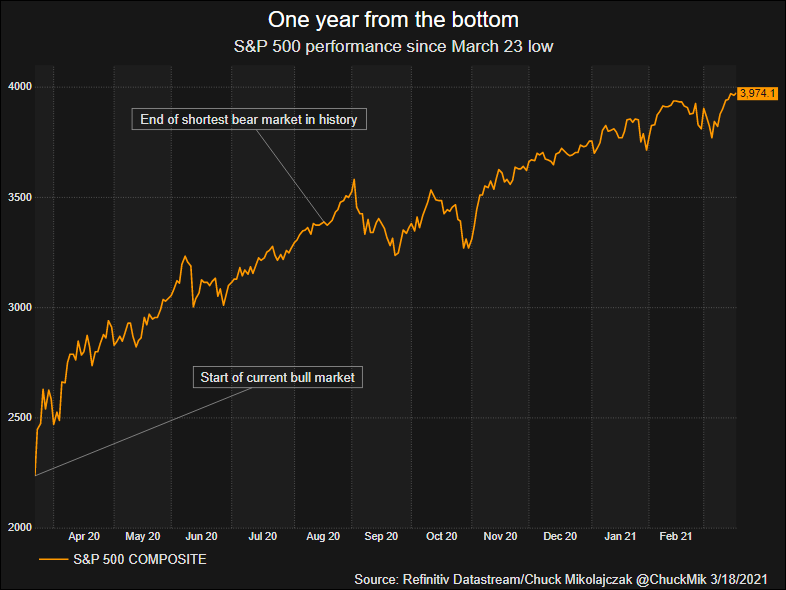
As investor optimism grew, stocks began to recover from the selloff that ended an 11-year bull market, history’s longest. The S&P 500 bottomed by closing at 2237.40 on March 23, and topped the Feb. 19, 2020 bull-market high on Aug. 18, when the index ended the session at 3389.78. That high marked the end of the shortest bear market ever and confirmed that on March 23 a new bull had been unleashed.
Initial lockdowns hit customer-facing services sectors the hardest as social distancing mandates to curb COVID’s spread shuttered restaurants and slammed the travel and leisure industry. Jobs in these sectors – typically on the lower end of the wage scale – evaporated overnight, and as new coronavirus infections spiked and abated, those jobs have been slow to return. Conversely, the shutdown caused consumer demand to shift from services to goods, boosting resilience of U.S. factories and prompting a restoration of manufacturing jobs that outpaced the whole.
Along with the stimulus supplied by the U.S. Federal Reserve and the government, stocks worked their way off the low thanks in part to the start of vaccine rollouts and optimism that economic reopenings were on the horizon. For instance, the equities market looked beyond grim current conditions and toward an expected recovery in commercial air travel, which can be seen by comparing air traffic data with airline stocks. Investors clearly see the battered sector taking off despite persistently low passenger numbers courtesy of the Transportation Safety Administration
The housing market has been the star of the U.S. economic recovery, rebounding beyond pre-pandemic levels as the hunt for lower population density and home office space, along with historically low mortgage rates, sent demand soaring, home prices surging and supply of homes on the market to all-time lows. Housing stocks have also handily outperformed the broader market since its nadir. A year later, the Philadelphia SE Housing index is up nearly 150%, almost double the S&P 500’s advance over the same time period.
Wall Street’s year of bust and boom, Reuters, Mar 22