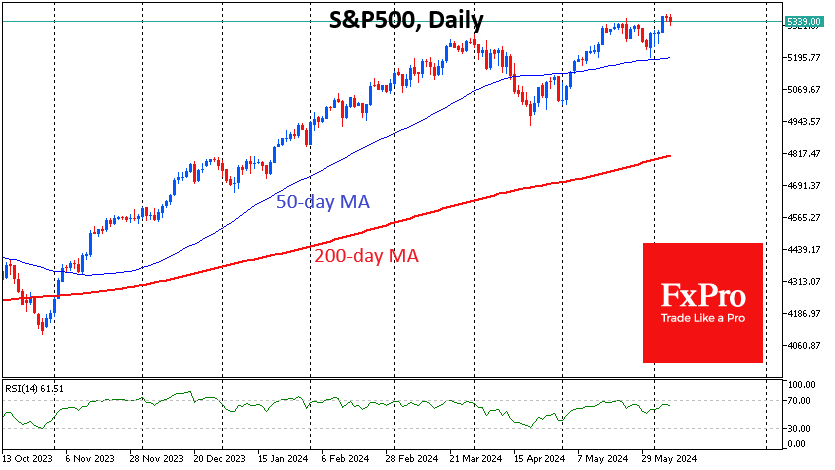
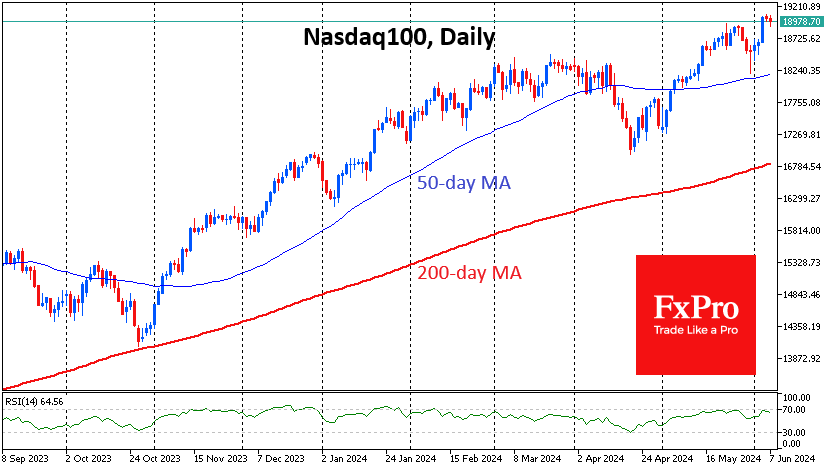
The US indices, S&P500 and Nasdaq100, closed Wednesday at record highs, taking a decisive step up, adding over 1.1% and 2%, respectively. The Dow Jones index lagged, adding just 0.25% for the day and is 3% off all-time highs. The Nasdaq-100 and S&P500 defended tops on Thursday, which seems more like a rest before rising rather than a downward reversal signal.

While the Fed has backed away from its original plan and is in no rush to cut rates, other major central banks have roughly stayed on the trajectory announced at the start of the year. Earlier in the week, the ECB and Bank of Canada cut their rates. The SNB made its policy easing move in March.
These actual moves by their colleagues, in addition to less strong economic data, stabilised expectations for the Fed Funds rate. Now, market participants, on average, expect two cuts totalling 50 points by the end of the year. This is a realistic midpoint in the range from the 5-6 rate cuts expected at the beginning of the year to the fears of a hike like we saw last month.
The start of a rate cut cycle and even a shift in medium-term expectations in that direction is favourable for risk appetite. This is the necessary fuel for further gains in equities.

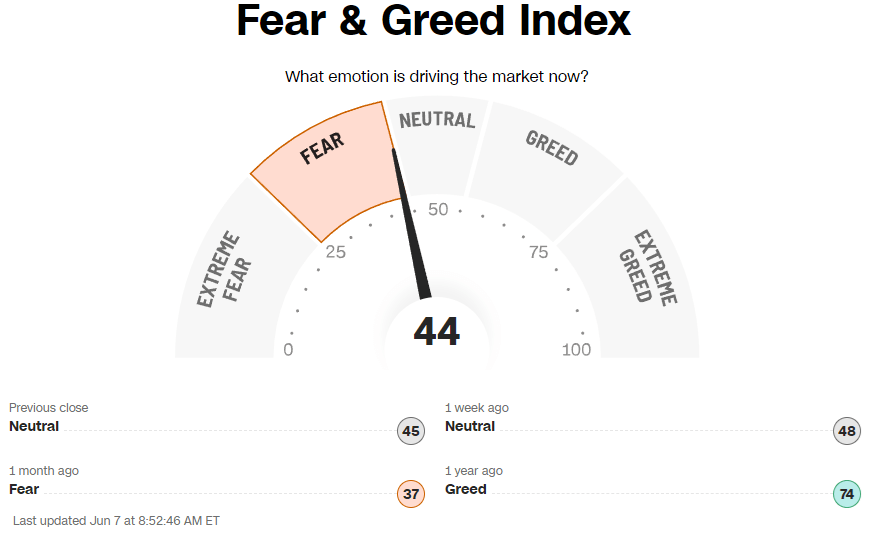
With the S&P500 hovering near its highs, it is surprising to see the Fear and Greed Index degrade to “fear.” It has fallen from 48 to 44 in one week as its Breadth and Strength components of stock price are in “extreme fear.” Safe Haven Demand and Junk Bond Demand points to “fear”.
This is a clear indication that a few heavyweights are now providing stock growth. The optimistic view is that these components have room to recover to normal, which can feed further index gains. A solid bounce off the 50-day average at the end of May is also in the bulls’ favour.
However, the pessimist’s view also has a valid point. Signs of insufficient breadth and strength of gains in equities could be the first warning bells of the global rally’s exhaustion. Also, on the S&P500 chart, a sequence of higher highs corresponds to a sequence of lower peaks, which is a significant bearish factor.
Who will win this battle? We will only be able to judge this at the end of trading next Wednesday following the market reaction to CPI and FOMC.
The FxPro Analyst Team