The rally in US indices passed an important milestone on Tuesday, greatly increasing the chances of ending the market correction that took place in the second half of July and early August.

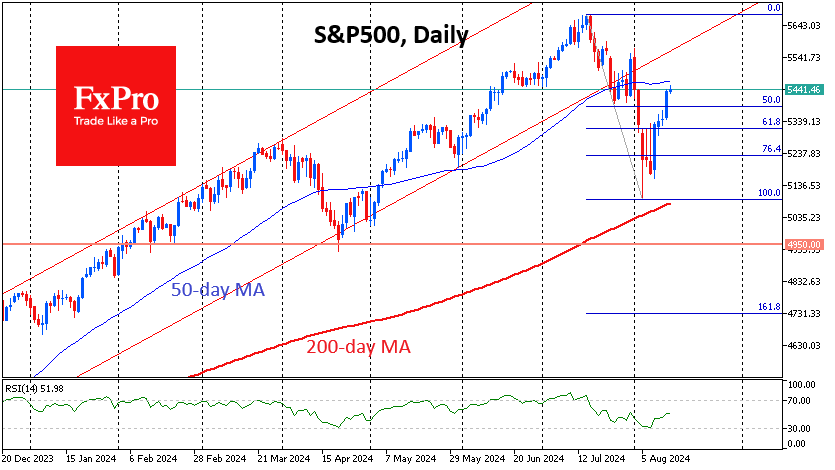
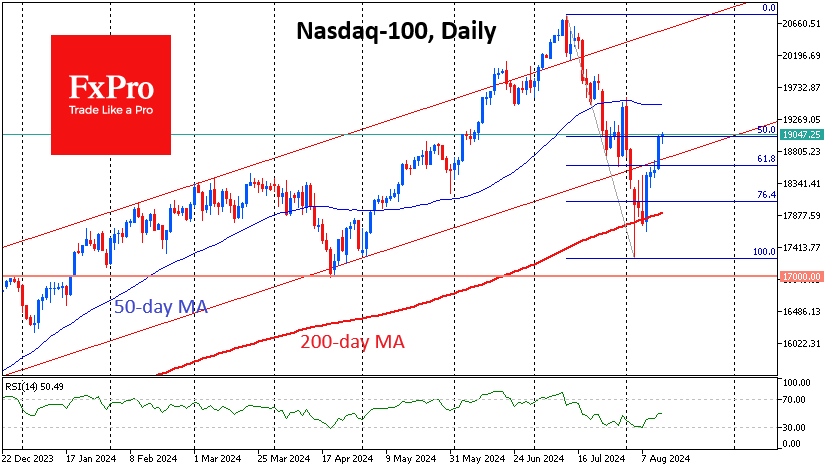
US indices have been rallying strongly since last Thursday when weekly employment data reassured investors that the labour market was not that bad. On Tuesday, the Nasdaq100 and the Dow Jones 30 broke above the 61.8% Fibonacci retracement of the decline from the July peak to the lows of 5 August. The S&P500 has retraced more than half of its nearly three-week decline from its all-time high on 16 July.
While the sell-off in early August looked daunting, it did not break through key technical levels, suggesting a correction of the gains from the lows of last October. The S&P500 managed to hold above its 200-day moving average and found strong support from buyers on the break below 5100. The low of the decline was also close to 61.8% of the total rise over the previous nine months, which fits almost perfectly into a Fibonacci retracement pattern.
The Dow Jones was also near its 200-day moving average in early August and 61.8% of the rally since the lows of October 2023. The Nasdaq-100 appeared heavier during last month’s sell-off, dipping below its 200-day average several times in early August and breaking above its 61.8% Fibonacci retracement from October. However, it has rebounded even more strongly and was trading 7% above its 200-day moving average on Wednesday afternoon.

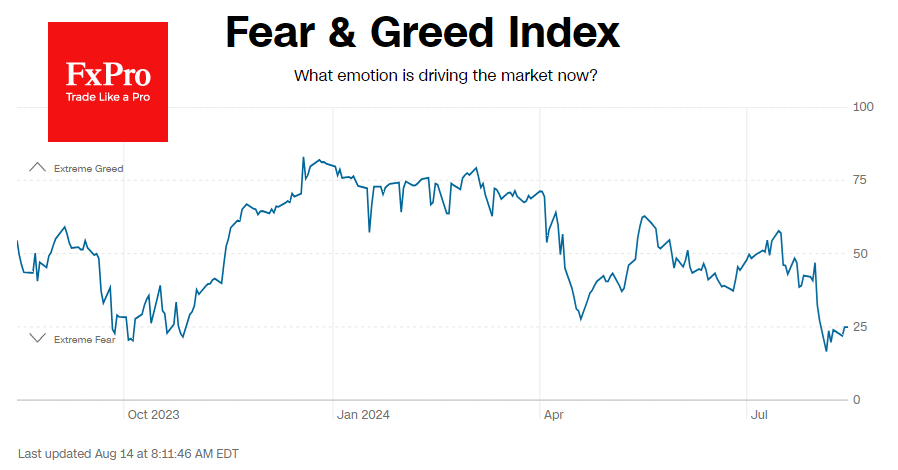
Important support factors include weaker inflation data and some improvement in the labour market, as highlighted by the weekly jobless claims. The ‘extreme fear’ sentiment ahead of these releases makes it comfortable for investors to buy into the downturn. The index bottomed on 5 August at 17 and has since recovered to 25. In April 2024 and October 2023, rebounds from this area triggered rallies to new highs.
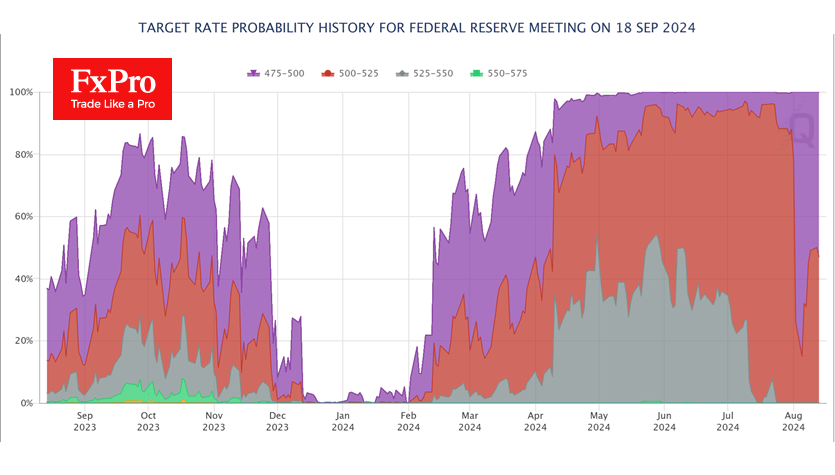
Markets continue to be supported by expectations of looser monetary policy, with a 53% chance of a 50bp rate cut. This is lower than the stressful 100% on 5 August but dramatically different from the 6% a month ago and the 90% chance of a standard 25bp move. While looser monetary policy is good for the equity market in the medium term, the flight to bonds is a sign of deleveraging, which puts additional stress on the financial market. A rebound in expectations for a 25bp cut could be a sign of renewed market calm and, counter-intuitively, support equity gains.

The FxPro Analyst Team