The recovery in equity markets has stalled along with new evidence of accelerating coronavirus spreading. There is a saying in the market: ” when the US is coughing, the world has a fever”. Market dynamics and economic cycles have repeatedly confirmed the validity of this observation. It is very alarming that the United States is now the hot spot for the spread of the disease. New data wiped out the hopes for stabilization of the situation as the total number in the US is approaching 190k with an increase of +26.4k over the last day.
This data wiped out the stock market’s optimism. The recent bounce in stocks has again attracted sellers among those who do not believe in the V-shaped recovery. Indeed, it is hard to find in the sustainability of the rebound when medics say “we are still climbing the mountain”.

Our currencies as indicators of market sentiment stepped down from recent extremums, indicating that there is still a long way ahead. The USDJPY dropped 3% over the week to 107.7, reflecting the recovery in demand for protective instruments. The Aussie finished the rebound and reversed downward, paving the way back to levels below 0.6000, which in 2008 served as a solid base for the rebound. No surprises there as economic shocks for Australis also, are far worth. Now investors brace themself for prolonged belt-tightening and negative impact on the economy.
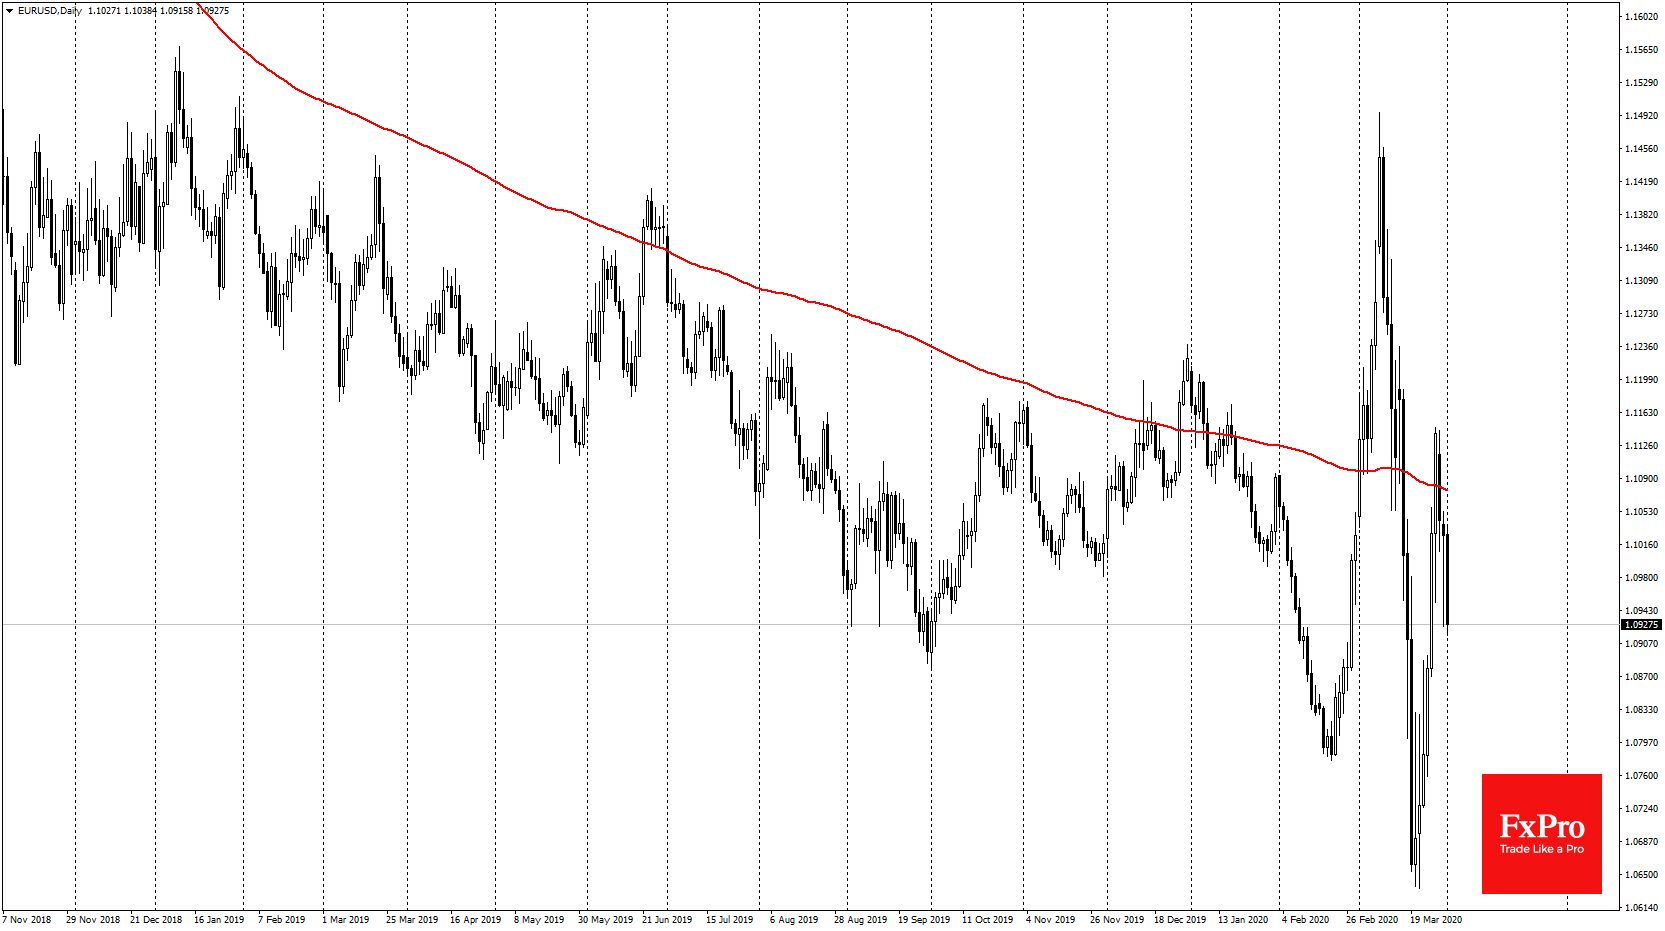
EURUSD, an indicator of European sentiment, has been declining for the third consecutive day, failing to stay above the 200 SMA where it climbed at the end of last week.
The most dangerous for the markets now may be a period of slow but persistent decline amid worsening economic expectations. The sharp collapse attracted buyers who thought that the sale in the first three weeks of March was too fast and too low. But, as we said before, you can’t bet on the recovery of the markets without sure signs of an improvement in the epidemiological situation. Perhaps, only after it will it be possible to make attempts to assess the damage to reflect this in asset prices.
USDCAD shows an indicative technical picture. From lows in January near 1.30 (crucial psychological level), the pair soared 13% to 1.4660. Subsequently, it stabilized at 1.4000 (another round level), almost clearly in line with the Fibonacci corrections, correcting 38.2% of the initial rally.
After that, the pair increased purchases again. According to this theory, the subsequent growth in the pair may target levels near 1.5700, where USDCAD hasn’t been since 2002. This level seems to be too distant for a reference point. However, oil prices returned in 2002. Keeping oil at these levels may force the Canadian currency (and economy) to adjust to this new reality.
