Change in the Nasdaq100. The selling on the Nasdaq100 from 12 to 19 April, which sent the index down more than 7%, has stimulated buying interest this week. They see falling prices as an opportunity to buy stocks at a reduced cost.

RSI dynamics. The rebound of the index coincided with the recovery of the RSI indicator on daily charts after it reached the oversold zone (below 30). Nevertheless, the April correction can be seen as a normalisation after a period of overbought conditions.
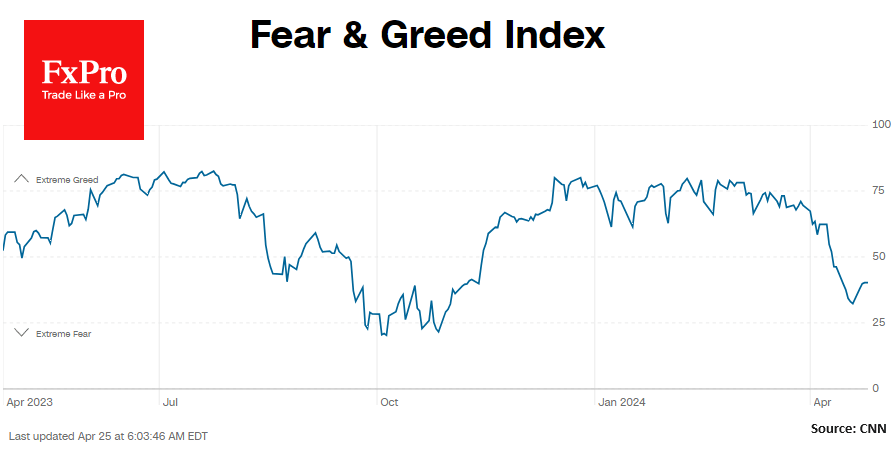
The Fear and Greed Index remains in the “fear” zone, with a low of 32 last week and a subsequent recovery to 40. A similar stock market correction lasting three months last year also included periods of improving sentiment as part of an overall downtrend.
Current Situation and Expectations. The Nasdaq100 lost about 1.2% on Wednesday, and the drop from high to low in futures was 2% in 8 hours. The 17700 level has become resistant again. Changes in Fed key rate expectations and investor inertia backed by macroeconomic reports could lead to a repeat of last year’s market pattern with a multi-month correction.
Potential downside targets. The area of the 200-day moving average, passing through 16300 and pointing upwards, could be a potential downside target. There is more chance of support in the 15800-16000 range, where the market encountered strong resistance in July 2023 and pushed back for upside in November.
The FxPro Analyst Team