Last week, the U.S. indexes ended up with an increase of almost 4%. The S&P500 rose 35% against its low of March 23, which is explained by the strong position of the Fed and the U.S. authorities. The same can be said about other countries to a large extent. However, the U.S.A. case is the most obvious with the weekly report on changes in the Fed’s balance sheet.

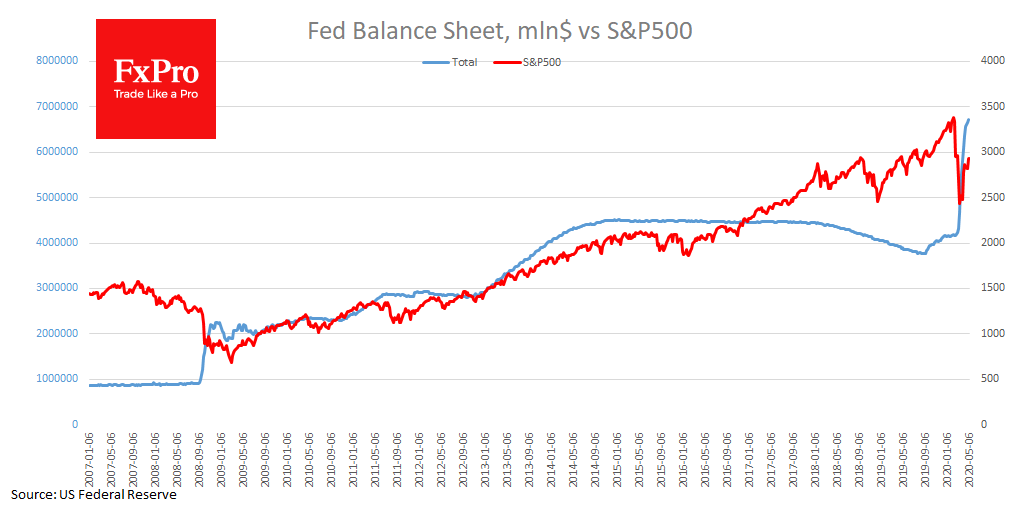
The chart clearly shows how the expansion of the balance sheet contributed to the S&P 500 index growth in previous weeks. If you look at history, you can also see how the market was learning. In 2008, the sharp expansion of the Fed balance did not prevent markets from falling for many months: the S&P 500 found its bottom in March when the most intensive phase of asset buying was already completed. In the following years, the Fed repeatedly launched QE programs, and at the time there were already enough of the Fed’s statements to push stock indices up.
In March and April, the Fed was more aggressive, and market participants already knew what to do – buy stocks and raise funds in debt markets. While the U.S. central bank does not buy shares, a significant part of the purchases of stocks in indices is based on the belief that the Fed will be able to fill the markets with liquidity.
It is very alarming that the Fed cuts the volume of expansion of its balance sheet weekly. In the last two weeks of March, the Fed’s balance sheet increased by $586bn and $557bn, while during the previous two weeks it was already $82.8bn and $65.5bn. Following this, the activity of stock buyers is fading. In 2017 markets managed to find internal growth drivers, despite the Fed’s passive position and even for a while to go against the balance cut. However, since 2019, market growth has already been indirectly supported by the central bank.
Such a dynamic can remain prevalent in the markets as long as there is no evidence of a terrible decline in people’s incomes in small companies and a shift to a more economical cost model.
Now, with record unemployment and the inability of many industries to operate at full capacity, will the market be able to find internal growth drivers again? – It is hard to believe.
The FxPro Analyst Team