


The Dollar is pushing its way up
September 29, 2021 @ 11:21 +03:00
The Dollar is squeezing its main rivals amid a reassessment of the Fed’s monetary policy outlook. In addition, pressure on long-term bonds is intensifying as US lawmakers do not agree in any way on the increase in the debt ceiling, adding to market nervousness.
Historically, the transition from one phase of the monetary policy cycle to the next by the Federal Reserve becomes the main driver of the markets for a few months and only loses its force after an impressive amount of time and after a considerable revaluation. Interestingly, however, a similar turnaround on the part of other central banks goes much more mildly.
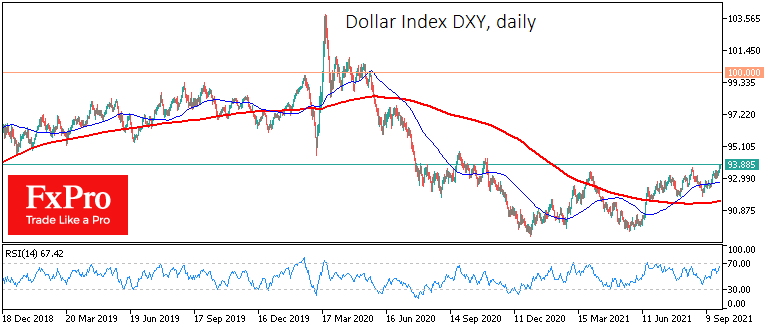
The Dollar index rose to its highest since last November, signalling a shift from a prolonged consolidation to an upward trend. At this stage, the strengthening of the Dollar looks quite tempered but going beyond the established boundaries is often accompanied by increased volatility.
We have previously noted that upward pressure in the USD could persist until the end of QE, i.e., until about the middle of next year, creating conditions for the Dollar to strengthen by about 7% from current levels into the 100 area on the DXY.
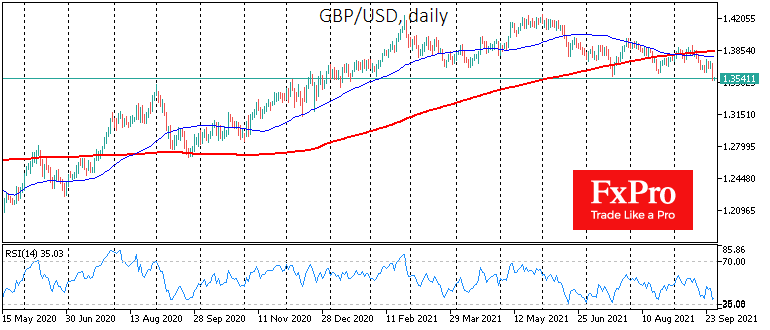
GBPUSD’s 1.2% drop during Tuesday became the latest illustration that Dollar’s buyers are not shy to move out of established ranges. Having started from a level near 1.3700, the active selling of the Pound stopped only near 1.3520, pushing the pair back to lows since mid-January, despite recent hawkish comments from the Bank of England.

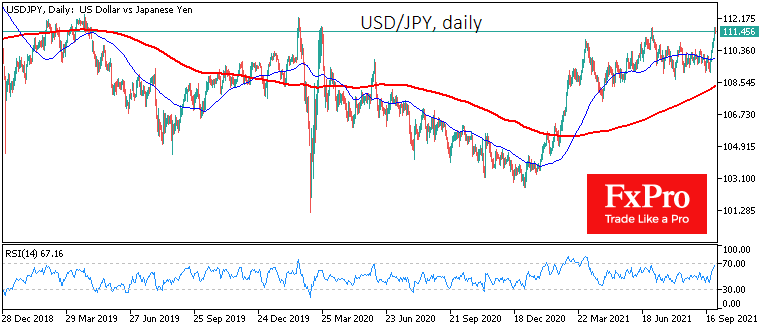
USDJPY is up 2.4% over the last seven days, bouncing from the lower end of its trading range since June to the highs from March 2020 at 111.7. The Dollar has not traded steadily above 112 Yen since late 2018.
It is also worth paying attention to the pattern change in the stock markets. On Tuesday, the S&P500 underwent a selloff, losing more than 2% to 4375 after touching the 50-day moving average at 4450 from below. This short-term trend line has shifted from support to resistance, indicating a change in market sentiment from buying on declines to selling on rises.
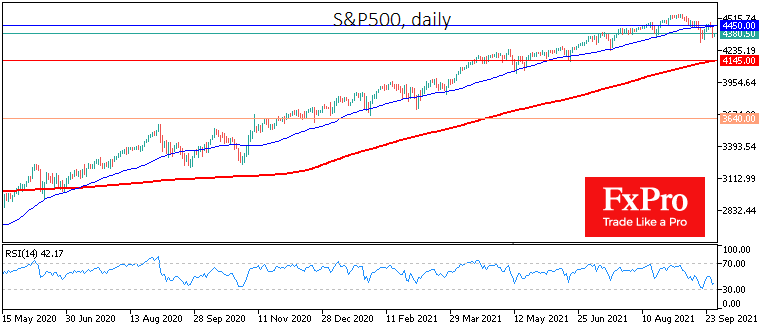
The latest pattern indicates that the market is ready for a deeper correction, probably towards the 200-SMA area, which is now near 4145. Long-term investors, however, should be aware that the current market overpricing is caused by policy normalisation, not by an economic crisis. So it would hardly be sensible to prepare to see a bear market start with a fall below 3640, where the index was last November.
The FxPro Analyst Team