By the end of Monday, US equity indices lost their growth momentum. The DowJones closed the day down 0.6%, remaining close to historic highs. The S&P500 was actively declining since the beginning of the regular trading session in the USA.

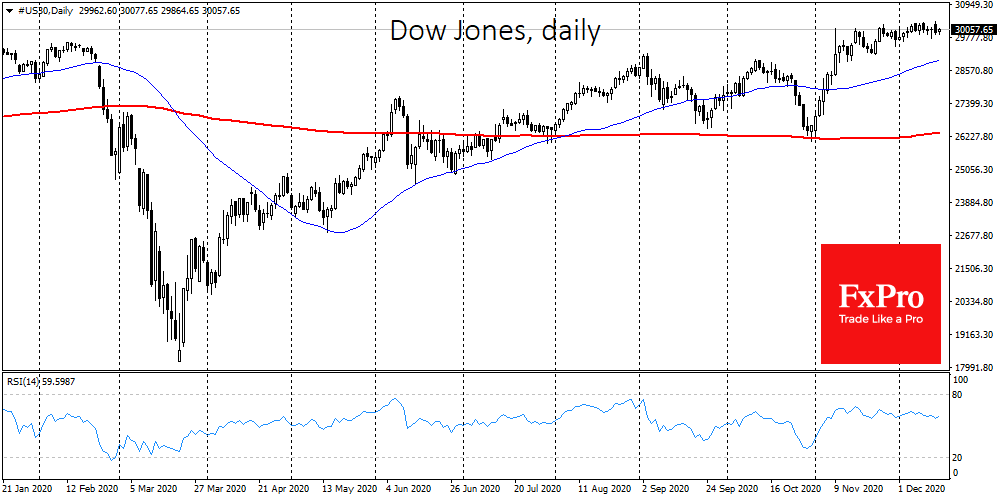
It is worth noting that the dynamics of the US indices since the end of last month are mainly characterised by selling the high pattern: each intraday strong growth impulse ends with increased selling.
These declines are quickly bought out, due to heightened liquidity thanks to the central banks and the promise of new support packages, therefore forming a very narrow trading range for the main indices. Practice shows that the longer the ranges are abnormally narrow, the stronger the move after a breakout can be, although it says little about its direction.
Optimism is extreme among retail investors in the markets right now. It is believed that ‘stocks only go up’, and if growth is reversed, the Fed and other key central banks switch on the printing press, which quickly brings prices back up and takes the indices to new highs in a matter of months.
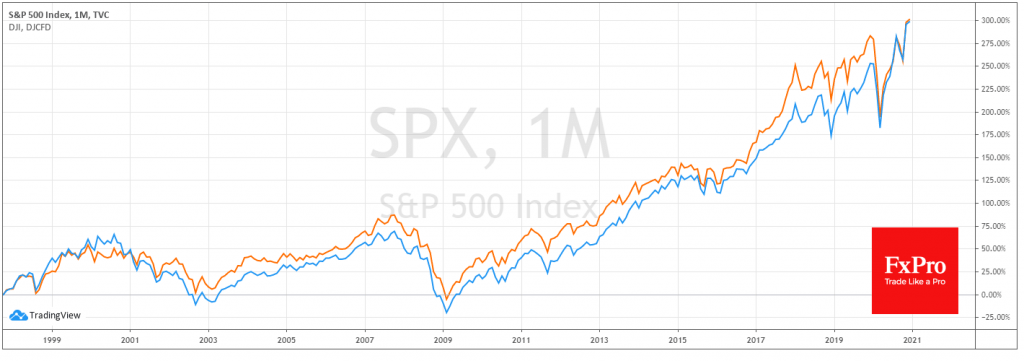
The effect of the Fed’s support for the markets this year has been much stronger than the famous Greenspan’s Put. However, investors should bear in mind that stocks can go through extended periods of decline. In 2000, the S&P500 and Dow Jones reversed to a decline that lasted almost three years. In October 2007 a year-and-a-half-long decline began. These are all examples from modern history with current monetary policy practices. Investors should remember that the regulators are supporting the liquidity of the markets, not the viability of individual companies and certainly not share prices.

The bears also have an exact short-term overbought position in many stock indices after the rally in November. But even more importantly, companies continue to lose revenue, cut dividends and, as the outlook becomes clearer, their future becomes more certain but also more difficult, and this undermines the sustainability of buying.
The main buying motive remains the fact that other sectors of the financial markets are concentrating even more risk through increased volatility or historically low bond yields, including junk bonds, where the sustainability of companies is in question. However, such sentiment can hardly be relied upon as a growth factor when deciding on long-term purchases.
Very soon, probably as early as early next year, this market situation could turn into a sharp increase in market volatility once investors move into truly promising investment ideas.
The FxPro Analyst Team