An active reassessment of the outlook for monetary policy continues in the financial markets, but these changes have so far not moved gold from its position near $1800. The latest gold performance shows that it remains a portfolio diversification instrument, with little correlation to stock indices.

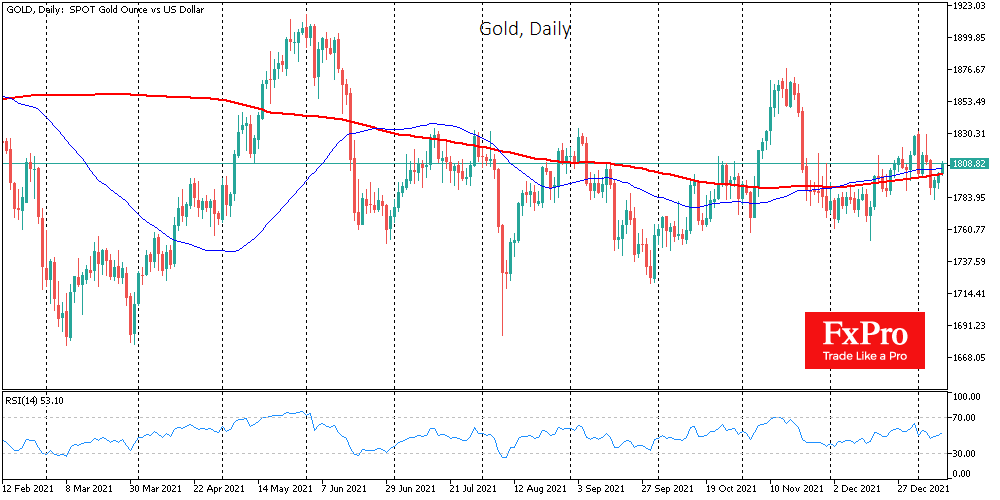
Gold has gained for the third consecutive day, almost hitting the $1810 level. Last week the price came under pressure along with stocks, as US government bond yields rose as investors preferred them over precious metals paying no dividends or coupons. Gold also decreased intraday on Monday on a sharp fall in equities.
However, buying on declines towards $1785 is well notable in gold. This is another jump around sustained buying. Previously, the areas of notable buying were $1760 in November and December and $1720 in August and September. Even earlier, in March 2021, gold got strong demand on dips to $1680.
It is important to note that the higher support levels in gold at the end of last year occurred at the same time as the bond yields were rising, so the correlation between these assets is not direct.
Historically, gold is vulnerable to rising long-term government bond yields only in case of a massive risk-off in the markets, which we witnessed in the epicentre of the last two global crises in 2008 right after the Lehman bankruptcy and in 2020 in the first weeks of the official pandemic.
If the Fed and other central bankers manage to rein in inflation without causing major market turbulence during the policy normalization period, it could be a good springboard for gold.
We have seen a similar example in the last tightening cycle. The first rate hike at the end of 2015 ended a corrective pullback in gold, becoming the starting point for a new six-month-long growth wave.
Now the approach of a rate hike could draw attention to gold as a hedge against declines in growth stocks, which have a high sensitivity to interest rate movements.
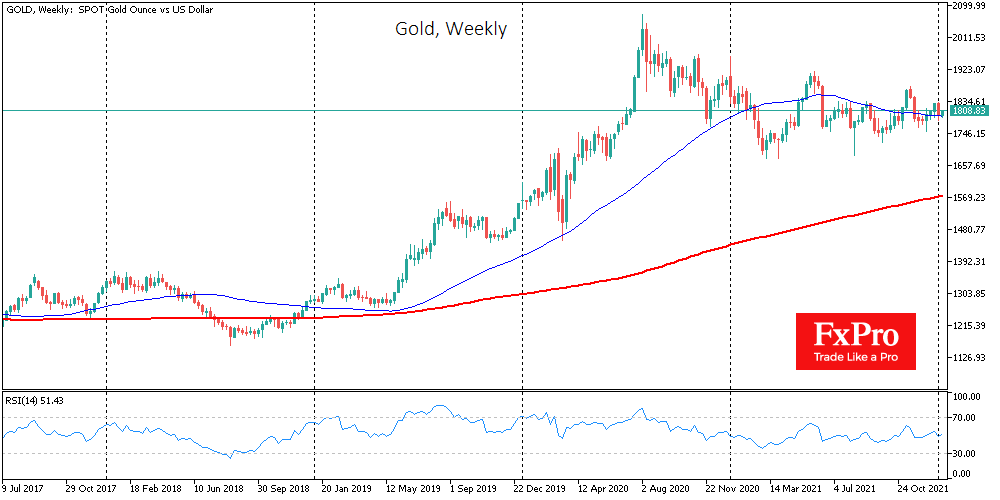
On the technical analysis side, if a new upside momentum in gold forms, it will lead the path to the $2500-2600 area after a 61.8% Fibonacci retracement from the August 2018 to August 2020 growth wave.
The FxPro Analyst Team