


Oil uptrend broken, potential bears target at $60-80
June 24, 2022 @ 13:21 +03:00
Brent crude oil is trading 14% below the highs set on June 9, showing declines almost every day since then. The sharp decline, more than 3.5% on Tuesday, has secured a break of the 50-day average and a break of the trend support line since December. Yesterday, we saw an attempt to get back above that level, following the rally in the stock indices.
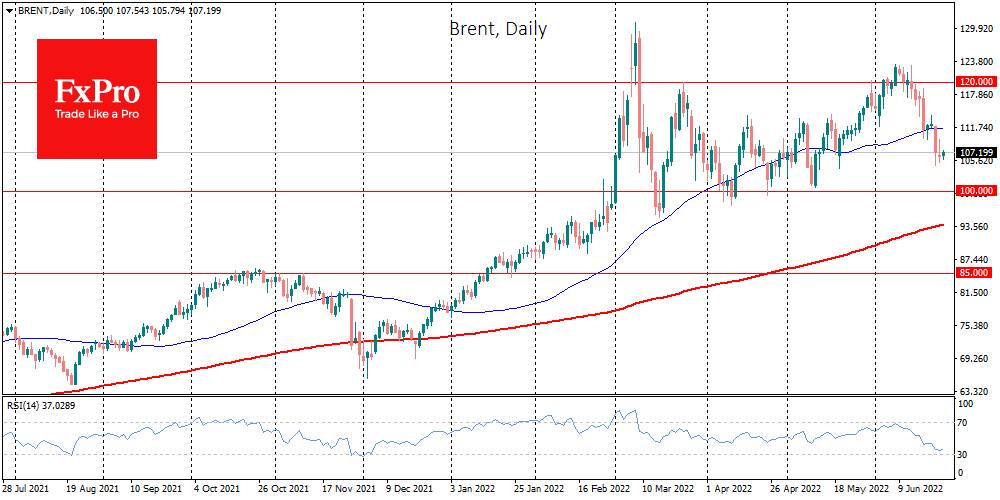
Although the formal break of the uptrend is only after a drop below the previous lows, near $101, we believe that the oil uptrend is already broken.
Interestingly, it was not Biden’s measures to curb prices through tax cuts and a sell-off from reserves that played into the hands of the bears. Oil was among the first to react to signs of slowing economic activity as a pro-cyclical commodity.
An increased chance of a recession in the US and the world has caused a sustained sell-off. It happens despite a parallel weakening of the dollar and a decline in bond yields, which often fuel the oil price.
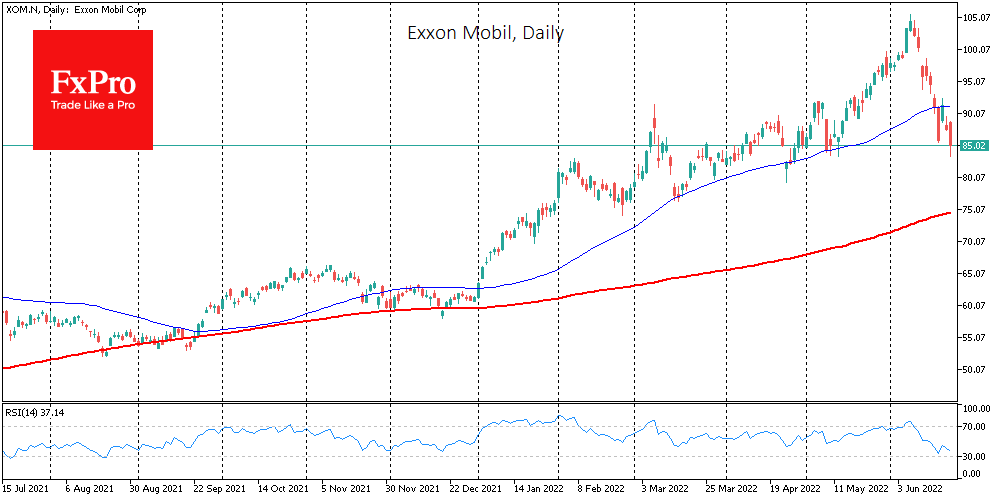
A major part of the story is the market sentiment for energy stocks. The giants, Chevron and Exxon Mobil, lost more than 3% yesterday against a 1% rise in the S&P500. Both stocks peaked on June 9, but now they are on the verge of a bear market, losing around 20% from the peak, coming at elevated trading volumes. This is a significant indicator that the oil uptrend has played out.

It is becoming clear that the world is not facing a catastrophic supply collapse as oil from Russia trickles into Asia. In parallel, OPEC and the US are increasing their production. At the same time, the energy price has become too high for buyers, leading to a drop in demand.
If we are right, the initial correction in oil prices may not have any meaningful stops until a pullback to around $100 against the current $107 in the next couple of weeks. Stabilisation near $100 would be an optimistic scenario. The world saw similar swings in the $100-130 range from 2011 to 2014, shifting more and more towards the lower end of that range over time.
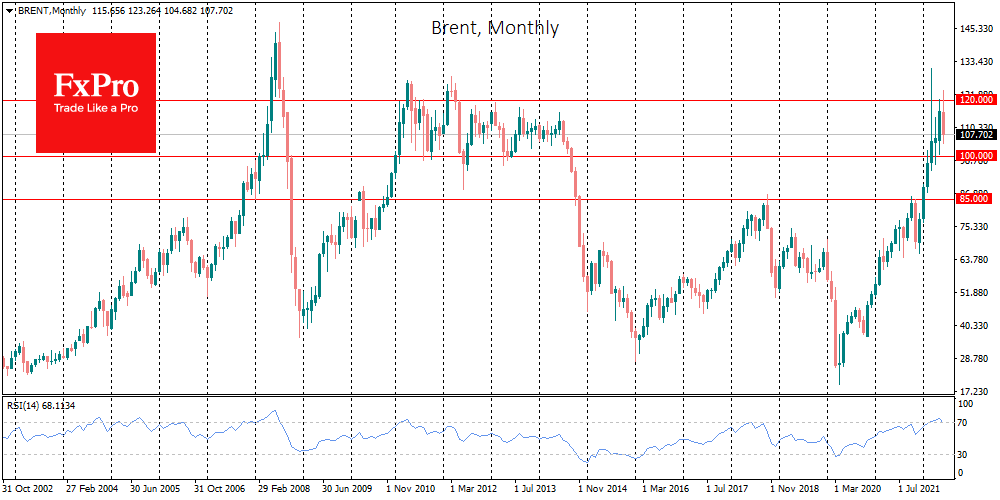
However, we see a more pessimistic scenario as the baseline. The 2011-2014 sideways trend is partly since monetary policy has remained extremely loose all this time. And it is essential to remember that at that time, the Fed raised rates by 25 points every two meetings versus 150 points in the last three meetings. In other words, oil went straight from a turbulent phase (akin to 2009-2011) into a situation like the end of 2014.
However, we exclude a scenario of more than a threefold collapse, as was the case from 2014 to 2016, as OPEC+ has become more coordinated over the past eight years. This coordination is likely to prevent the oil price from falling below $60 in a pessimistic scenario for the economy, allowing it to quickly bounce back to $80-85.
The FxPro Analyst Team