


Oil stumbled 200-day MA
April 17, 2023 @ 14:50 +03:00
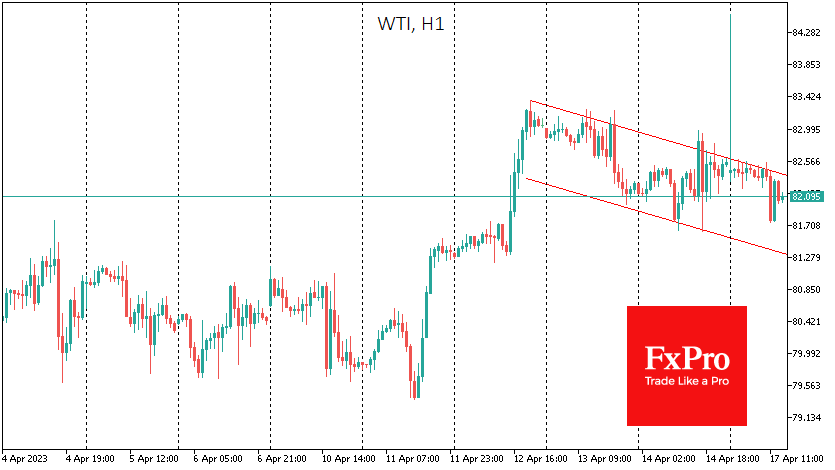
WTI Crude Oil is trading below $82 a barrel at the start of the new week and remains below its 200-day moving average. Crude oil was not allowed to break above this critical curve for the banks and big players, signalling to them that the bearish trend was in force.
As March progressed, we saw oil drop out of the established $72-82 trading range and almost as quickly bounce back into it. We also saw a failed attempt to break out of the range last week.
Crude’s momentum has slowed as it approaches its 200-day MA after rising nearly 30% over the past three weeks. Large traders and funds look at this curve as a long-term trend indicator: Higher readings indicate an uptrend, and lower readings indicate a downtrend.
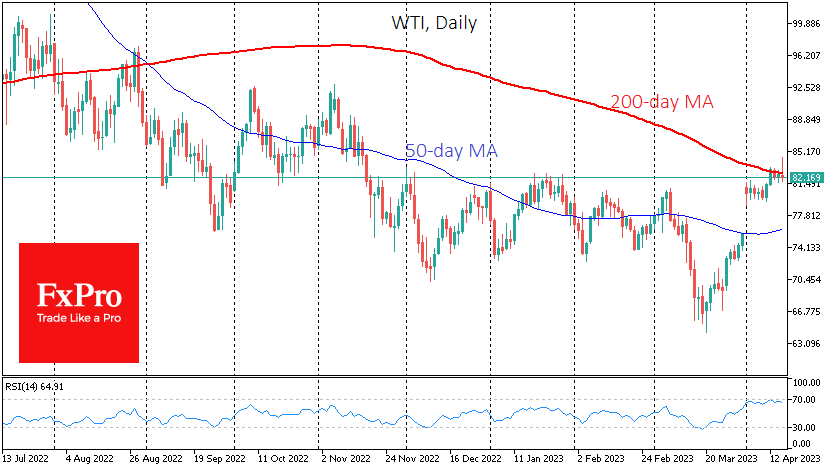
This line acted as critical support during oil’s bullish rally from 2020 to mid-2022. A break below it in August 2022 was the prologue to a one-third drop in price over the next eight months.
Last week and early this week, we saw the first touch of this curve, which is now acting as resistance. In addition, fatigue from the previous rally is working against oil.

On the daily timeframe, the RSI oscillator came very close to the overbought territory in the middle of last week, suggesting a potential correction. A series of lower intraday highs indicates that a more active correction is about to begin.
On the technical side, the $80 area, which was the starting point of the last rally, looks like the next target on the downside for WTI. However, a correction to this area would likely only fuel the bears. A potentially more interesting target would be to close the gap from the first trading day of April when the market was rocked by an unexpected OPEC+ quota cut over the weekend. This would take the price back to $75.7.
This would confirm the bearish reversal from the 200-day MA and take the price back below the 50-day MA, which is the medium-term trend.
The FxPro Analyst Team