


Oil Poised for Breakout: Key Support Levels Tested
April 22, 2024 @ 14:21 +03:00
Oil prices have retreated to their lowest levels since late March, approaching a critical support level.
WTI barrels dipped to $80.60 early on Monday. The price found support at the $80.0-$80.50 zone a month ago before accelerating higher and breaking through the resistance of the ascending channel. Last week’s sell-off pushed the price back into this channel.
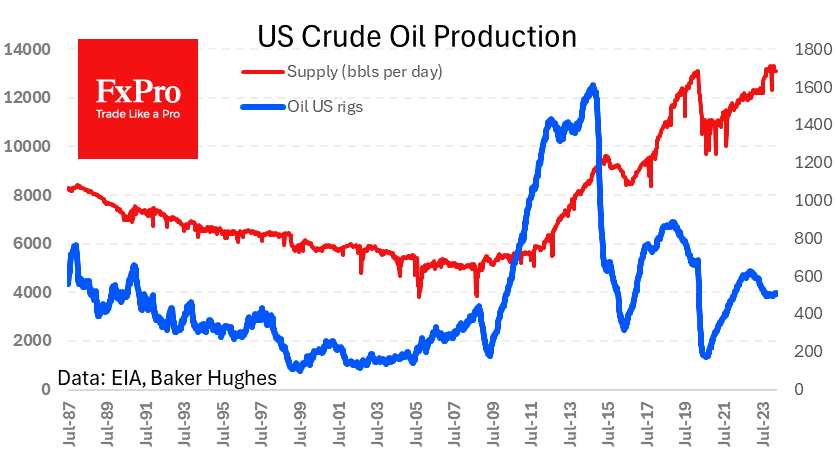
The macroeconomic backdrop is stacked against bulls: US oil inventories are rising, the number of oil rigs is higher than at any time since September, and the IMF is forecasting an increase in OPEC+ quotas from mid-year. The dollar is strengthening, and stock indexes are falling, adding pressure to the price.
The price per barrel is testing the 50-day moving average (currently at $80.60). A close above it in January sparked a three-month rally.
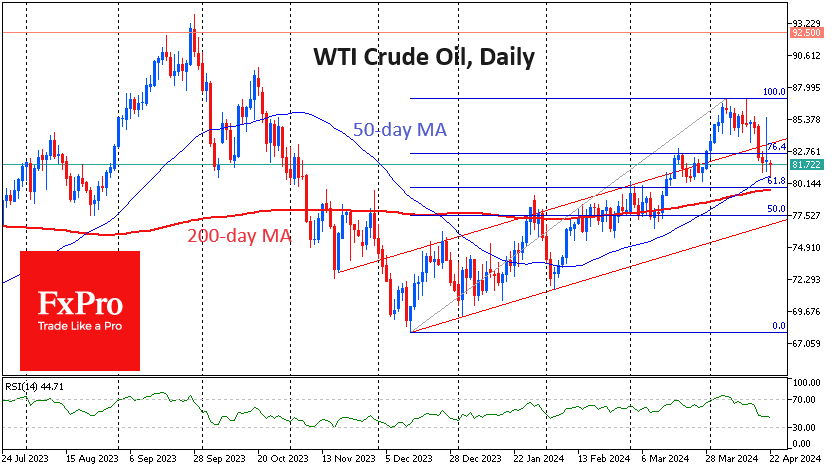
Through 79.60, just $1 below, lies the 200-day moving average. A break below it could signal a shift in the long-term trend. In the past two years, there has been a surge in volatility after touching the 200-day average: the market either broke decisively above it or bounced sharply off it.

These days, the 200-day moving average coincides with the 61.8% Fibonacci retracement level from the December lows to the April peak. A break below would suggest a resumption of the long-term downtrend, bringing prices back to cycle lows around $70. The ability to hold above the 200-day moving average would suggest a Fibonacci extension with a potential upside target near $100.
Thus, the oil price action in the coming days deserves attention from both traders (promising volatility) and investors, as it will determine the long-term trend.
The FxPro Analyst Team