Oil broke a major support line on Wednesday, falling to its lowest since January. The significance of the breakout is further underlined by its strength, with an intraday drop of more than 6%.

Oil prices fell right below the highs of the previous momentum in October last year. The basis, which the market bulls had been building all last month, could not withstand the economic slowdown leading to a decline in demand and a rising dollar.
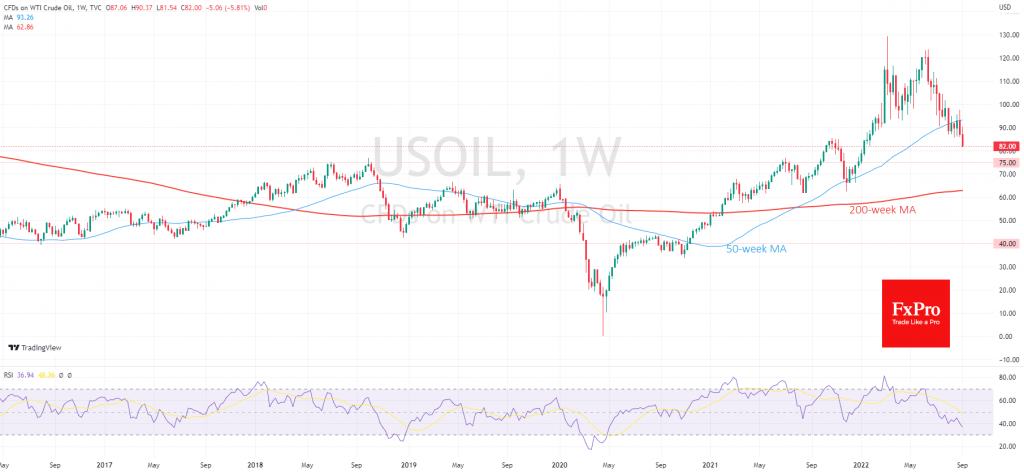
On the weekly charts, you can see that the technical reversal pattern got confirmation in the first days of September, on the close of last week’s candlestick. Those same weekly charts also show a bearish divergence in the price and RSI, which triggered the reversal in early June.
The last time a similar technical pattern we saw in 2018. Incidentally, the coincidence of the situations reinforces that the Fed was in an active policy tightening cycle when markets seriously feared a recession. At that time, Crude lost more than 40% to $42 from a peak near $75, coming close to the long-term break-even point.

In the second part of the last week, the price failed to stay above the 50-week average, which we consider the one-year average. This failure triggered a liquidation of long positions, further amplified the move.
From a technical analysis point of view, the move still has significant downside potential. Last time, oil went deep into the oversold territory before it found the strength to reverse.
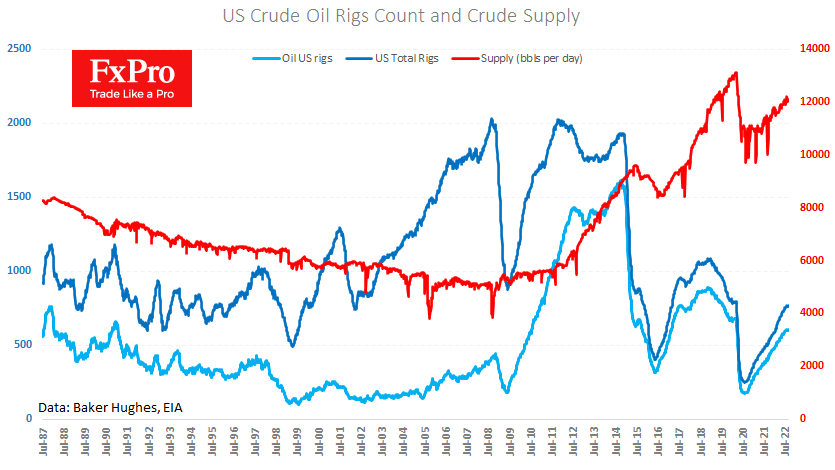
Traders and investors should be prepared that the bears may not end this game until producers start to withdraw from the market. For now, the latest data shows US production at 12.1M BPD, with Russia and Saudi Arabia each producing around 10M BPD. These are appropriate levels for healthy economic growth. For a slowing world, it is too much.
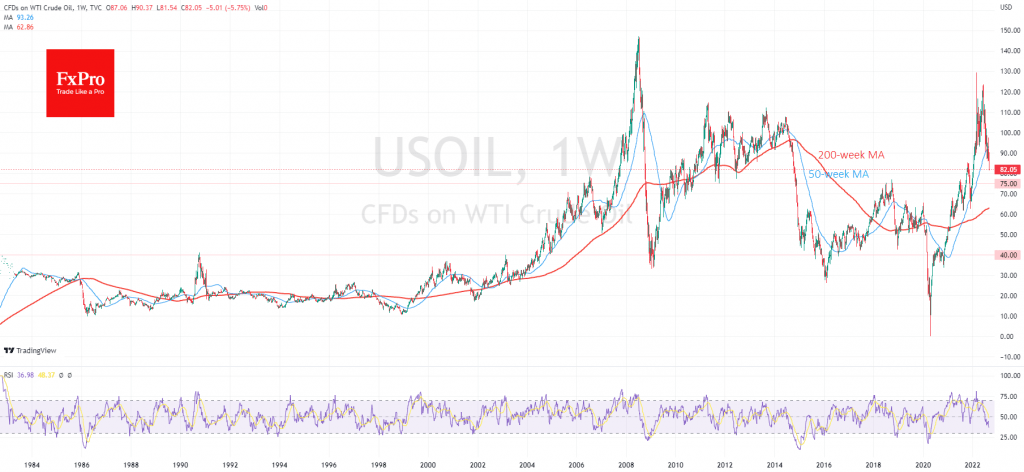
In our view, the $40 level again acts as an ambitious target for the bears, as it has been over the last 18 years. Like it did for this period, it can create chaos in the oil-producing countries and the whole sector. If we look that far down, we need to look to the $75 a barrel area, near which oil repeatedly reversed in 2018. Here it is likely that the OPEC+ cartel will put tighter price support measures back on the agenda by reducing production more aggressively.
The FxPro Analyst Team