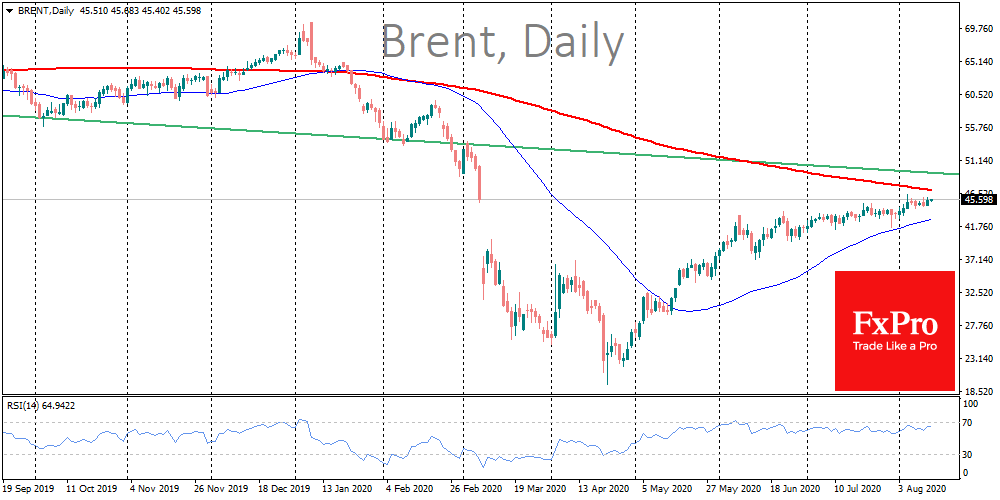
Despite the very cautious growth of oil, the situation more and more resembles a compressed spring ready to shoot up at any moment to the area of $50 per barrel of American WTI and $53 per Brent.

Despite some stoppages and slippages, there is still an upward slope in global markets. The world economy continues to recover from the spring slump, without significant grounds for prolonged pressure on financial markets.
Of course, the situation is still much worse than at the beginning of the year. However, the monetary policy in recent months was mild, nourishing the hunt for yielding assets.
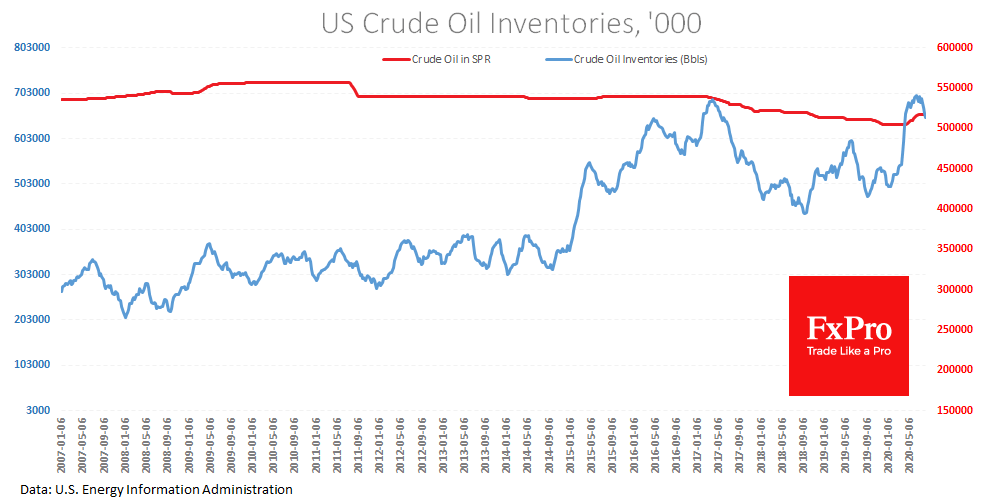
Restrictions on oil production have shifted the balance of power towards demand in the US. Fresh data showed a decline in crude oil reserves for the third week in a row, by 22.5 mln barrels. This decline is slightly ahead of seasonal trends.
Commercial stocks are now 16.7% above last year’s level, compared to 20.5% that we saw three weeks ago. The strategic oil reserve also shows a symbolic decline.
Last week oil production fell to 10.7 mln barrels per day. Except for one week in June, this is the lowest figure since May 2018.
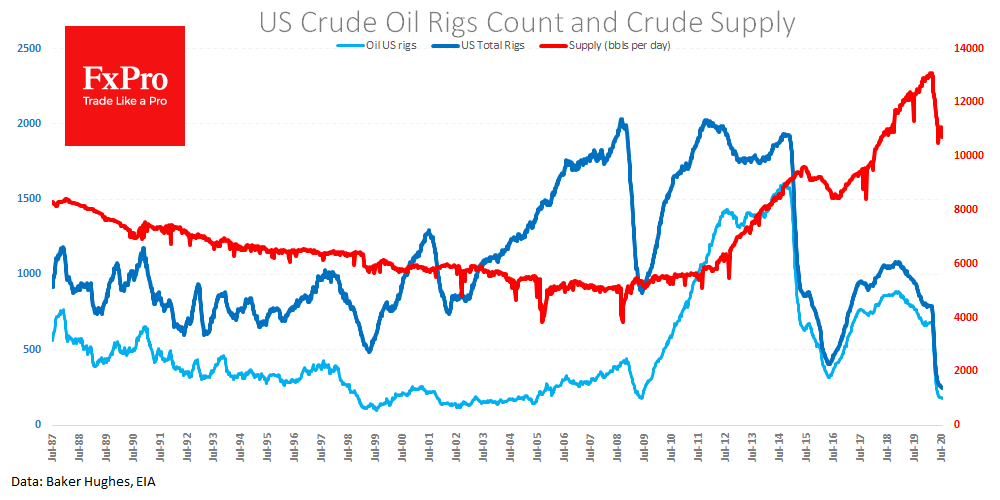
Data on the number of drilling rigs in operation also confirm the trend of a decline in the activity of oil workers. Last week the amount fell to 176, a new low since 2005. The total number of rigs fell to 247, continuously updating historic lows, giving energy market share to other producers.
At the same time, inflation in the USA, as well as in the whole world, has already reversed upward. Yesterday, the US data surprised with a spike in the core price index (excluding food and energy). This is often a sign of healthy consumer demand, which is very controversial these days. Yet in any case, inflation is spurring the price of oil and other commodities. Multiple increases in oil prices often accompany periods of higher inflation, and we may well be at the start of one of these periods.
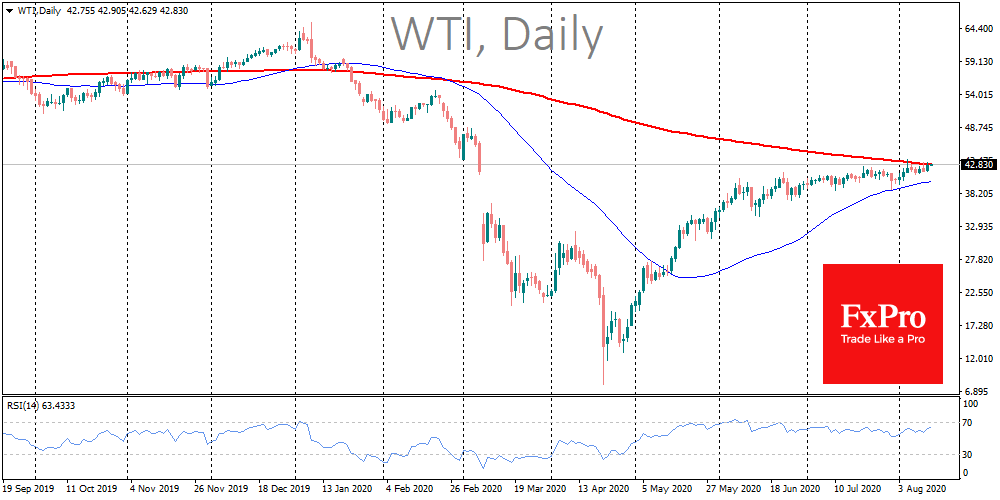
The short-term technical picture also seems bullish. The WTI price was quickly redeemed at the end of July after touching the 50-day moving average and is now approaching a 200-DMA, which is currently acting as a resistance. However, the submission of the bears and the exit above $42.75 might trigger further buying, quickly taking the price to $48 and may even test $50 next month.
For Brent, significant levels of attraction are in the $47 (200-DMA) and $54 (highs of March and lows of February) area, where the price may move in September.
The FxPro Analyst Team