The markets have taken a beating: the rise in volatility on FX and equities around the world is clearly visible. Commodity markets have also been hit. Traders who have seen the markets move live since the global financial crisis must recognise the nature of the movement. It all looks like a typical risk-off trade, in which the higher the risk on an asset, the harder it falls. But there are also two small reasons to hang on to panic risk selling.

In some stocks, stop orders are clearly being triggered when we see more than 10% intraday declines in popular stocks like Tesla and Ford. However, tech giants – market favourites of recent years – have also been hit. The Nasdaq100 index lost about 3.5% on Wednesday, led by a sell-off in US stocks as quarterly reports failed to meet expectations that had become inflated.
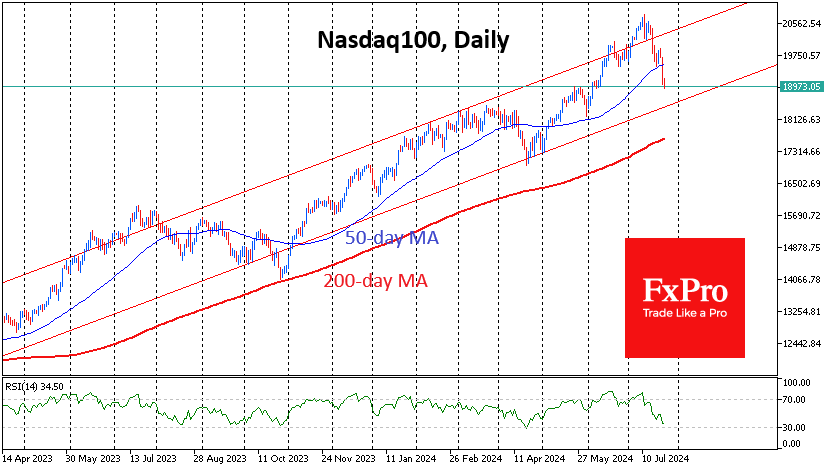
Technicals are also among the suspected reasons. The sell-off in the Nasdaq100 gained momentum after the index fell below its 50-day moving average. In June and July, the index went high into overbought territory on daily RSI timeframes.
From the high on 11 July to the intraday lows of the day on 25 July, which is exactly two weeks, the Nasdaq100 is down 9%, which is near informal correction territory (down over 10% from the peak).
The latest pullback fits into an uptrend formed since early 2023, with a potential pullback target at the lower boundary of this corridor, 18300-18500. This area is also interesting because there was active resistance here in March and April, and at the end of May, it was already working as support. A failure below would indicate that we are seeing more than a routine shakeout.
On the bullish side, the idea of rotation from Big-Tech to smaller companies is still on the table, as the Russell 2000 just started its rally on 11 July and is now 7.5% above the levels of that starting point. So, while the drawdown in many stocks is quite painful, it is due to their apparent overheating earlier.
We also pay attention to the VIX index. It fell a little short of the 19 level on Wednesday, having reached a three-month high. In our observations, meaningful sell-offs have only occurred when the VIX jumped above 20.
July and August are often weak months as investors prefer to rebalance positions and prepare for the start of the new US financial and fiscal year in October.
Thus, the US market dynamics over the next few days will help determine whether we see a short-term correction, albeit a furious one, or whether this is the beginning of a bear market, which at worst could be a repeat of what we saw in 2000-2002 or 2007-2009.
The FxPro Analyst Team