


Has Nasdaq U-turned?
October 14, 2022 @ 16:07 +03:00
Thursday’s performance in crucial US equity indices appeared to be the long-awaited reversal pattern: a long decline, final capitulation on bad news, and strong reversal for no apparent reason.
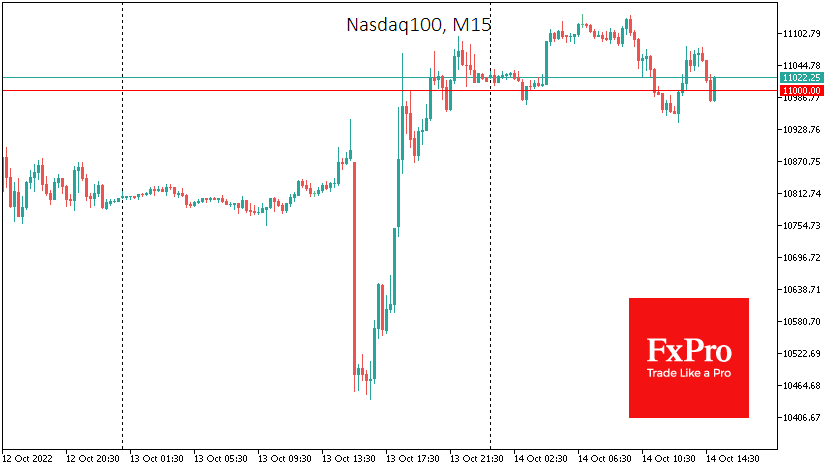
The Nasdaq100 index is up more than 6.5% from its intraday bottom to its highs in European trading, drawing a long tail at the bottom of the daily candle yesterday. Additional bullish signals are also the accumulated oversold conditions from two months of relatively flat declines, which created the conditions for massive coverage of short positions, which we probably saw yesterday.
It’s hard to argue with the thesis that too much negativity is embedded in prices. The sell-off on downbeat news, triggered by the rapid work of trading robots, which took away about 4% in less than 2 minutes, activated buyers just over an hour later, which more than compensated for the initial decline. This amplitude of change has been extremely rare in history. But we are also unlikely to find a combination of this kind of reversal without a meaningful reason.
Among the most frequent explanations is that the most pessimistic of all possible scenarios were built into prices: a 75-point rate hike at the next two meetings. After this, market participants turned their attention to substantial discounts to prices from their highs with a relatively healthy economy that continues to create jobs and raise wages.
Despite October’s notoriety as a “bear market killer” and an auspicious intraday move, investors should maintain a certain degree of caution. A real change in trend requires a shift in fundamentals. And those changes are still not easy to identify.

Oil’s reversal from negative territory has only proven sustainable after coordinated and decisive action by oil consumers and producers. The turnaround in equities in 2020 was supported by unprecedented efforts by governments and central bankers.
But there was no new information yesterday that promised to ease investor pain. Quite the opposite – the data worsened expectations. Without support from the fundamentals, the technical rebound can get choked by new selling rather quickly.
Also, it is worth paying attention to the dynamics near the following points on the way up. First is the ability of Nasdaq100 to close the day and week above 11,000 – two days of gains above the round level can inspire more buyer confidence.
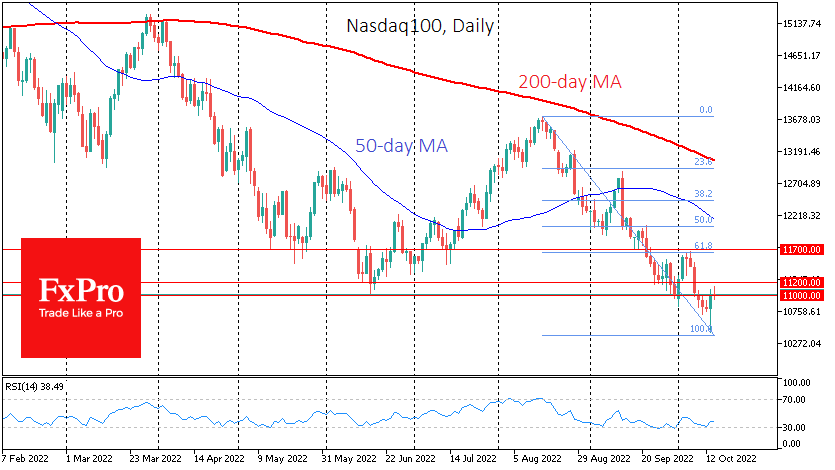
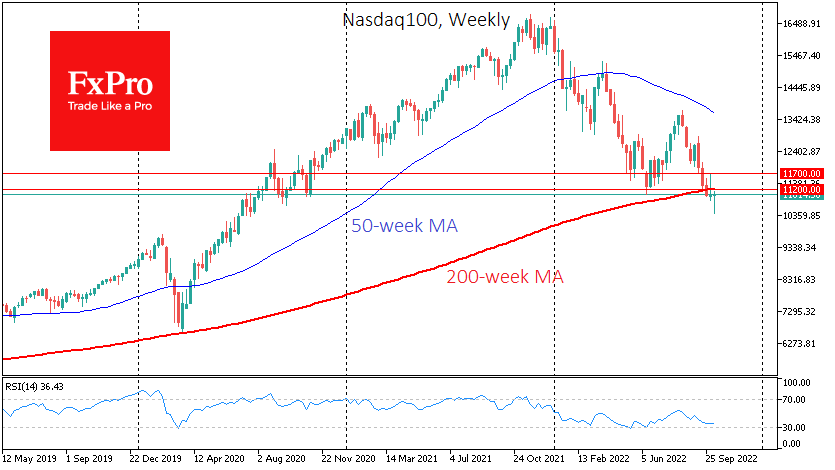
The following signal line is the 11,200 area, where the 200-week moving average is set. This is also the former support area in the index in June, which can now become resistance.
The next checkpoint is the 11,700 area, where the 61.8% Fibonacci retracement level from the August-October decline and the early-month highs are located.
A successful and rapid break-up of the checkpoints mentioned above may become a meaningful signal of an end to the bear market that took over 35% of the highs of last November from the Nasdaq100.
The FxPro Analyst Team