On Friday and Monday, we saw legendary moves in gold. On Friday evening, the price rose to $2075 on the background of risk appetite with reduced liquidity in the instrument. On Monday, the price of gold reached $2145, a new historical price maximum.

The nature of the movement on Friday and Monday morning suggests that we have seen the bears in gold wash out of the market. As liquidity returned, the price pulled back to $2060. This is still extreme territory, as the price only spent a few hours above.
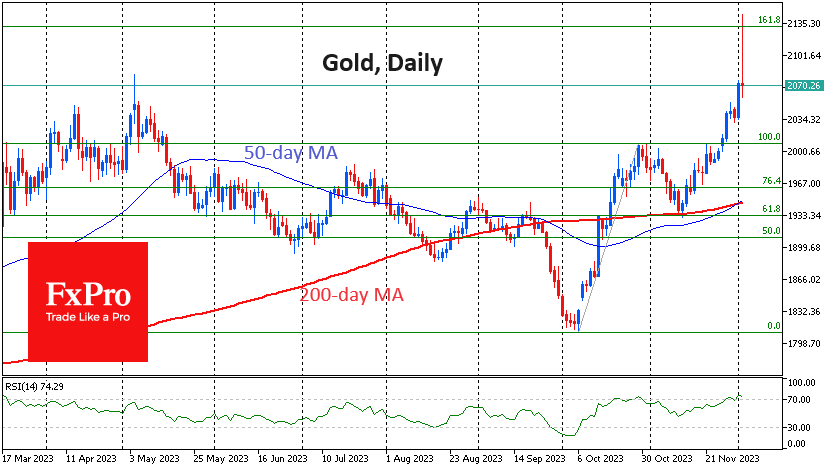
Among the bullish technical signals, we note the Golden Cross formed when the 50-day moving average exceeded the 200-day moving average. In addition, the price is above this crossover, which also strengthens the bullish signal.
Still, joining the upward move in gold may be too dangerous right now. On the daily charts, the RSI is flirting with overbought territory, creating correction risks. The upward movement generally fits into a Fibonacci pattern with an initial impulse from $1810 to $2007, followed by a correction to $1932. The realisation of this pattern suggests a 161.8% retracement of the initial rise to 2129. This is a fairly accurate execution of the pattern, given the low-liquidity trading hours and historical highs.
The next few days for gold are decisive for the subsequent trend. The ability to hold above $2050 will point to continued extreme bullish sentiment in the precious metals market.
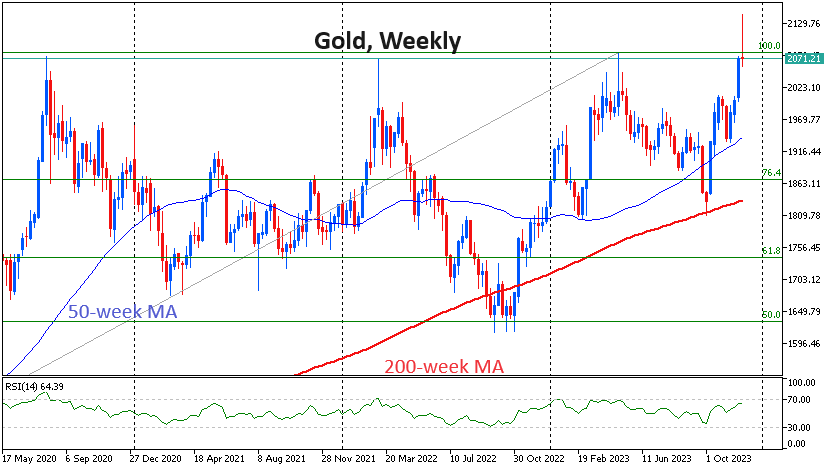
The previous three times that gold made highs – in 2011 and three times in the last three years – it went into a sharp and deep correction that lasted for years in the first case and months in the aftermath of the pandemic.
The latter scenario looks more likely, given lower inflation fears and attractive yields in bonds, gold’s main competitor.
The FxPro Analyst Team