


Gold tries to break through historical resistance
March 01, 2024 @ 18:25 +03:00
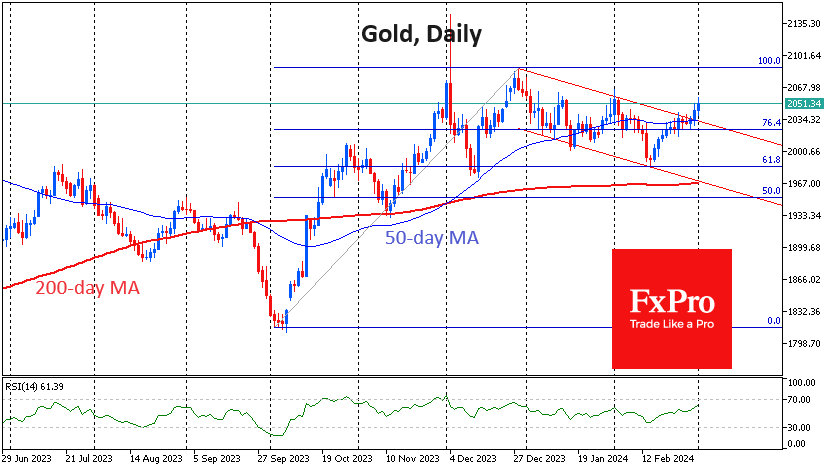
Gold has gained less than 1% over the past two days, but the gains are significant because they mark a break in the downtrend since late December. Thursday’s and Friday’s gains also reaffirm gold’s ability to rise above its 50-day moving average, which it failed to do a month ago.
Since peaking at the very end of last year, gold has been in a downtrend, forming a series of declining local highs and lows.
Since mid-February, risk appetite has been growing in financial markets, as evidenced by the synchronised increase in buying in European and Asian markets and the ongoing rally in cryptocurrencies since the beginning of the month.
No need to rush, as we can only call a break of the downtrend corridor after a consolidation above the previous high. Gold is currently testing this top at $2055, which is a substantial level from which selling has intensified since early January. Moreover, the price has failed to consolidate above this level since August 2020. It could well be called a historical resistance.
It will be possible to talk about the realisation of the bullish scenario for gold after the daily candle closes above $2055. In this case, the first target for growth will be in the region of $2088 – the December high.

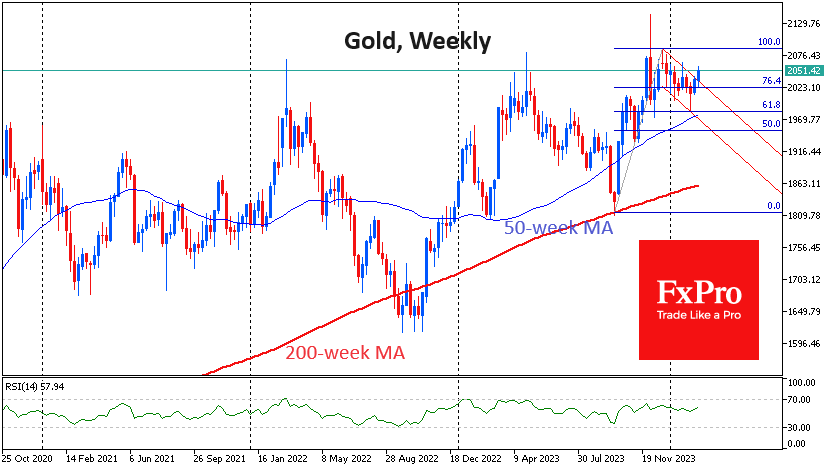
There is an even longer-term scenario. The pullback from the beginning of the year to mid-February is a classic Fibonacci retracement of 61.8% of the first growth impulse from the October lows. The realisation of this scenario will be the advance to $2255 (161.8% of the first advance).
The FxPro Analyst Team