


Gold: End of correction or new downturn?
February 21, 2023 @ 14:34 +03:00
Gold has lost more than 6.5% from its early February highs, correcting the November-January rally. Now it’s time to decide on the next trend. The coming days should show whether we will see a new wave of growth in gold or whether the decline will continue.
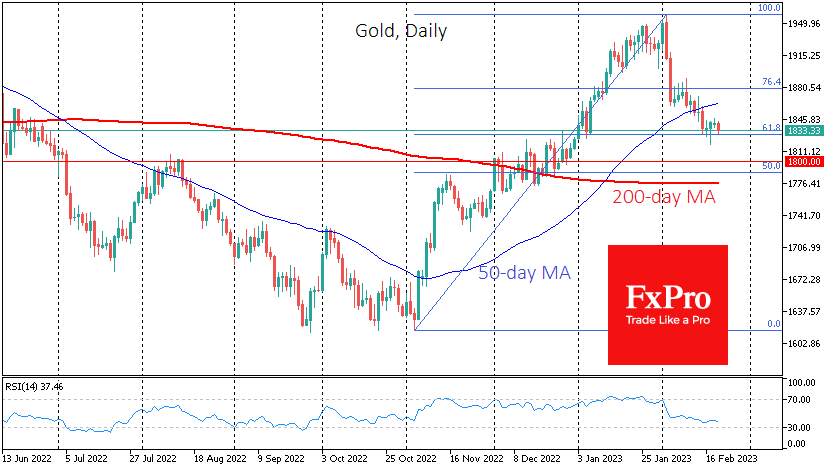
From the beginning of November to the first days of February, gold gained more than 21%. The February declines stabilised the price at 61.8% of the initial rally, a classic retracement. This pattern suggests buyers are returning and opens the potential for a rally to $2170 (161.8% of the initial rally). A more conservative view suggests that the path to new highs will only open up after a sharp rise above previous highs at $1960.
Another indicator, the Relative Strength Index (RSI) on the daily timeframe, suggests that there is still room for a decline. According to this indicator, gold has been overbought for most of January and has yet to reach the oversold zone.
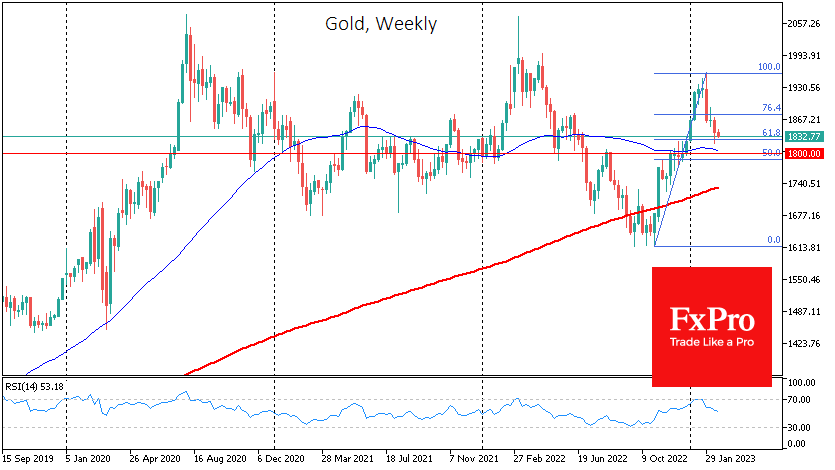
On the weekly timeframe, the reversal in February coincided with a touch of overbought conditions, and so far, the indicator remains above 50, indicating the potential for further declines.
In addition, we note that mid-month gold fell below the 50-day moving average, which has worked well as a short-term trend indicator over the past year. When gold breaks below this moving average without any resistance from buyers, it looks like a signal that bearish sentiment is prevailing.

It is worth being prepared for the fact that gold’s decline has paused but not ended. Up to the $1775-1800 area, we do not see any significant barriers to the fall. A break there would also allow the overbought RSI to correct fully. Gold has reversed several times near $1800, especially last year.
The FxPro Analyst Team