


Fed stops market rally again, but there is some hope
December 16, 2022 @ 21:37 +03:00
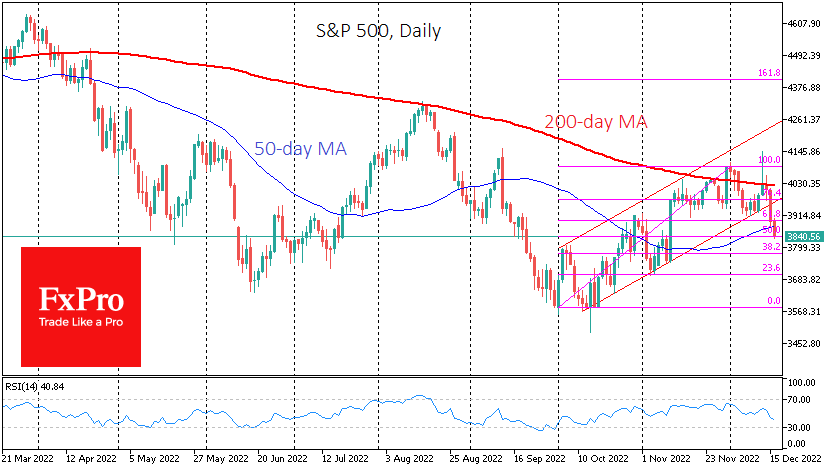
For the third time since April, the S&P500 index faces a sharp sell-off from the 200-day average. And all times, the fundamental reason is a more hawkish Fed policy than the markets had hoped for.
In June-August and October-December, the S&P500 started with a technical reversal after it oversold the market. Later buying was supported by signs of weakening inflation, which fed hopes that the Fed would soften its tone. However, Powell and co have been persistent in embedding the idea in the markets that the fight against inflation will be extended. About as insistent as assurances about the “transitory” nature of inflation in 2021.
Even if the Fed is wrong in its forecasts now, it can raise the rate so sharply that it will first put a heavy burden on the financial market and, through it, on the entire economy. It is believed that it takes several quarters before the effects of a change in monetary policy are fully reflected in the economy.
This is probably why the economy has continued to create jobs despite the most violent monetary tightening cycle since the 1980s. More problems lie ahead, which is predicted by the Fed, expecting GDP growth of only 0.5% and a jump in unemployment from 3.7% to 4.6% over 2023.
However, we must remember that the market can be wrong too. The general expectation right now is that the developed world is suffering permanently from low inflation and that the current jump is due to an unfortunate concurrence of one-off factors, the effects of which are already wearing off. So far, we saw a pullback in ship container costs to pre-covid-19 ‘normal’ levels and Crude Oil return to 12-month lows. However, low unemployment and de-globalisation can keep inflationary pressures markedly above the Fed’s target for the foreseeable future.

However, this week’s dynamics are worrying if one looks out of context and only at the charts. After the inflation release, the almost 3% surge in S&P 500 futures was trashed in less than 3 hours. The market closed that day under the 200-day MA, doubting the downtrend break.
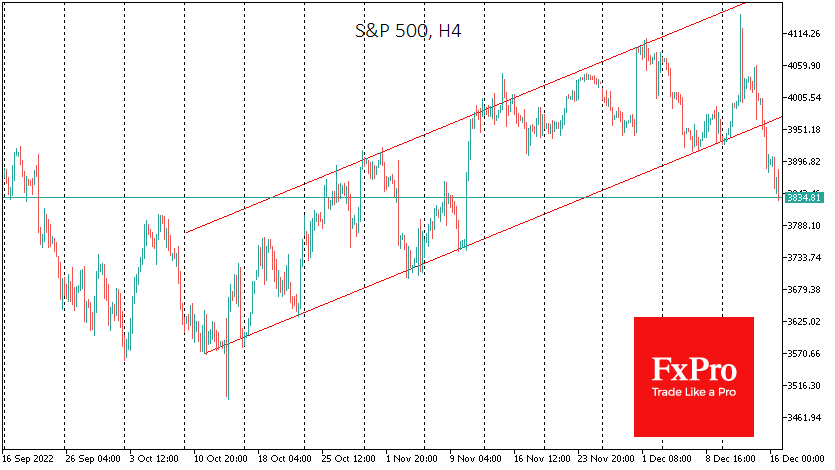
The strong selling since Wednesday is very similar to what we saw in April and August reversals. On top of that, the index flew over the 61.8% Fibonacci mark of the rise since the beginning of October during the fall. In Thursday’s trading, the S&P500 fell helplessly out of the up-trending trading channel that has been neatly forming over the past two-plus months.
In theory, a sharp rebound is possible today due to the large-scale quarterly expiry of futures and options. However, a likely increase in trading volumes today could work for both bulls and bears. In addition, we note that still the Fed has lowered the rate hike step and did not dismiss the idea that the next hike could be 0.25 points.
We also continue to see bullish signals in related markets. The Dow Jones index remained above its 200-day average and drew a “golden cross” to start the week. EURUSD and GBPUSD have crossed their 200-day averages and attracted buyers on the dip.
The FxPro Analyst Team