The dollar index lost another 0.3% on Tuesday to 92.27, under moderate pressure since late March, when it peaked at 93.46. The exchange rate has fallen below the 200-day moving average during this decline, a meaningful long-term trend signal line.
More recently, at the end of March, the DXY crossed this line upwards but soon lost the upside momentum, indicating indecisiveness from buyers. In this situation, investors and traders should see several signals.

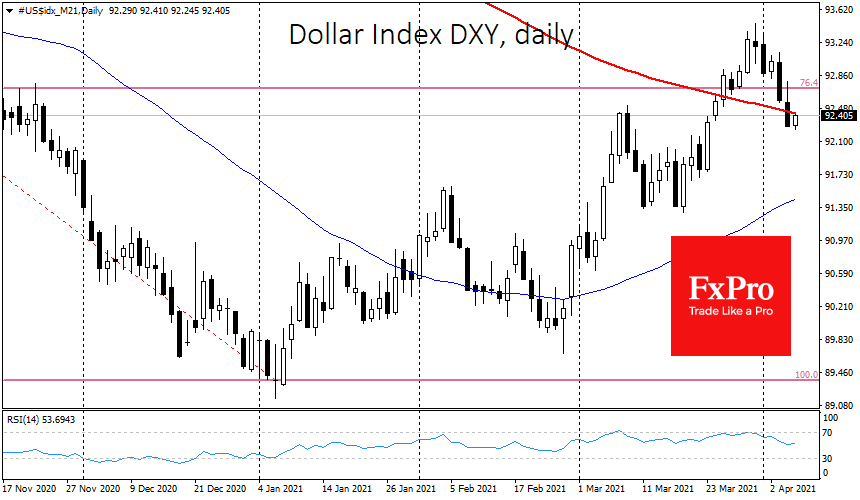
Behind the crossing of the 200 SMA, the instrument often instinctively follows the break-up direction for some time. Therefore, a USD index decline below its trend line could be followed by a further downward movement. Also, the RSI indicator might be attractive for USD sellers. It has recently returned to normal values after being overbought (above 70), supporting Dollar’s pressure.
With a slightly longer trading horizon, traders would be wise to wait for a bullish or bearish confirmation because such swings around an important line often turn out to be false. For instance, there have been about a dozen episodes of dips under the 200-day average in DXY over the past two years. However, the Dollar has reversed to the upside, gaining support from buyers on those declines.
We didn’t see a decisive break in the Dollar’s uptrend until May last year, followed by an 8% dip in the index before seeing stabilisation and a pullback. Thanks to the correction from January, the DXY briefly got back above the 200-day average in late March. However, this pullback is the same hesitant attempt to break the trend, as we saw in 2019 and early 2020.
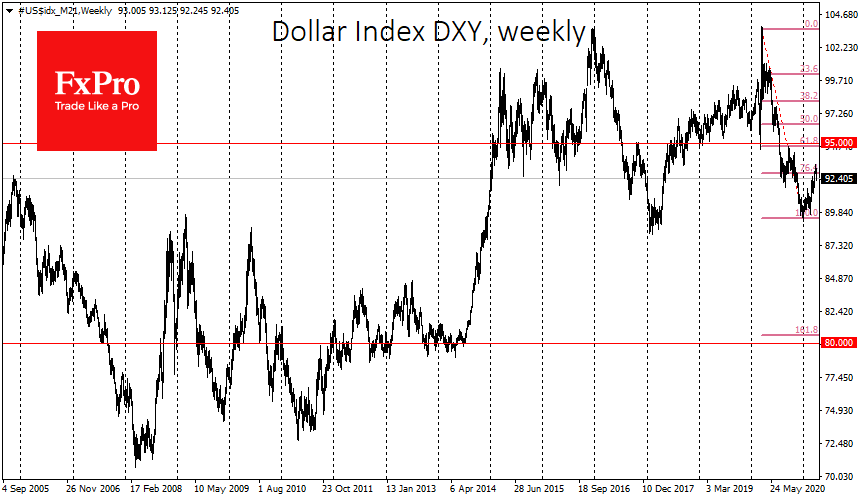
If our bearish expectations are correct, then the USD growth in the last three months turned out to be nothing more than a slightly sloppy correction from the previous declines. Its move above the 200-day average and the 23.6% Fibonacci retracement level from the March 2020-January 2021 decline was only temporarily.
If that is the case, we will already see the Dollar Index return to the year’s lows near 90 in the coming months. This is also the bottom area of 2018. A drop below would pave the way for the DXY index to go to 80, the lowest rate since 2014.
The FxPro Analyst Team