Long-term US government bond yields continue to rise. This is already having a noticeable effect on other markets, and stock indices closed Tuesday lower, retreating from record levels. However, the most worrisome shift seems to be in gold.
The troy ounce was down 1.5% on Tuesday, falling under $1800 for the second time this month and continuing to trade $10 below that line, the lower bound of its trading range for the past eight months.

While those are highs by historical standards, the move lower to those levels reflects a reversal of the last two years’ up-trend. Let’s take a closer look at these signals.
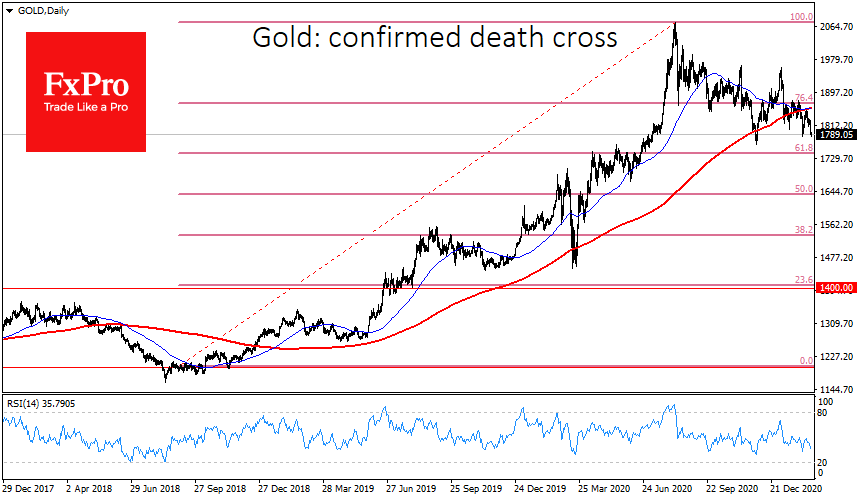
Gold has shed its positions for the fifth consecutive trading session after it failed in its attempt to return above the 50- and 200-day averages. So it was an apparent failure to return to the growing trend.
A separate bearish short-term signal is the sinking of the 50-day average under the 200-day average, the so-called “death cross”. Such a pattern last formed in June 2018, after which the price lost 10% in the following two months. In 2016, the decline near such a signal reached 13% and also lasted about two months.
The current wave of the gold rally started in August-September 2018 from levels near $1200 to $2075, which were reached in August 2020. The nearest target for further selling looks to be the $1734 level, a 61.8% Fibonacci retracement of the previous rising wave.
This area is also notable as the price was hovering around it for two months in April-June last year.
A deeper correction, 50% of the two-year growth, would drive the price back to $1630, where it was during the extreme volatility of the markets due to the pandemic last March. A plunge into this area corresponds to the price dynamics after the previous two “death crosses”. Besides, gold often gives up to 50% of its gains before the rally resumes.
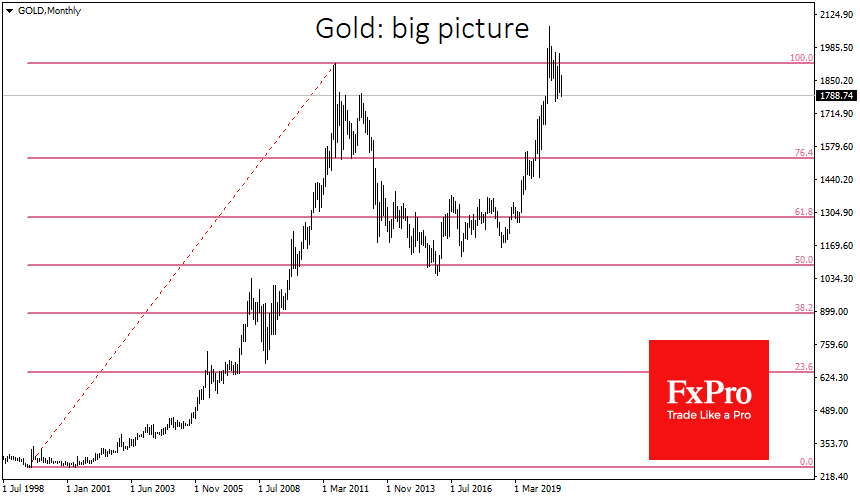
Long-term buyers may look at the current situation as a short-term fluctuation. The broader picture suggests that having given up 50% of its 2001-2011 rally, gold started a new bullish cycle in 2016 with potential targets at $3000 in the coming years.
The FxPro Analyst Team