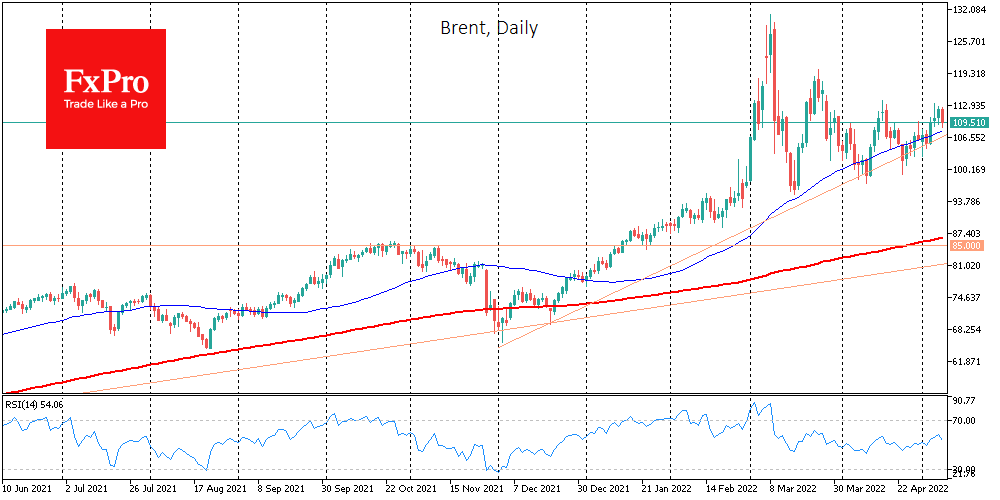
Brent crude is back below $110/bbl, losing 2% since the start of the day on Monday. At the beginning of May, oil largely remained within the trends of previous months. There are still accumulating risks that oil will break down this support, giving the start of a correction.

Brent maintains an upward trend, but it is also running near a line that passes near the lows of the last five months. Since last month, bulls and bears have been concentrating on pulling the tug-of-war near the 50-day average, which has been pointing upwards since the beginning of the year.
Positively for oil, the G7 has declared a phase-out of Russian oil purchases, and OPEC has indicated a commitment to a rate increase of 432k a month.
But at the same time, Saudi Arabia has cut its oil price premium to buyers in Europe and Asia.
Also playing out locally against oil was the news that Russia has stabilised production after a dip in April. In addition, drilling activity is picking up in the US, which promises a rise in output in the next few months. There is also more incentive for Saudi Arabia to increase its production.
Brent remains in a triangle on the technical analysis side, retreating from its upper boundary. Locally, traders should pay attention to the dynamics of Brent near $112, where the area of previous local peaks is located. Bears, for their part, may cheer up in case of consolidation under $104, where purchases were strengthened last week.
A move out of the $104-$112 range could increase volatility in oil.
The FxPro Analyst Team