The past few days have been packed with economic news from China, from inflation figures to a press conference on stimulus measures. While market reaction to the data has been relatively mixed, there is a lingering sense of disappointment that may well build over the coming days.
The CPI slowed to 0.4% y/y versus the expected previous 0.6%. While prices have risen year-on-year for the past seven months, the pace has been very close to zero. CPI growth has not exceeded 2% for almost two years.

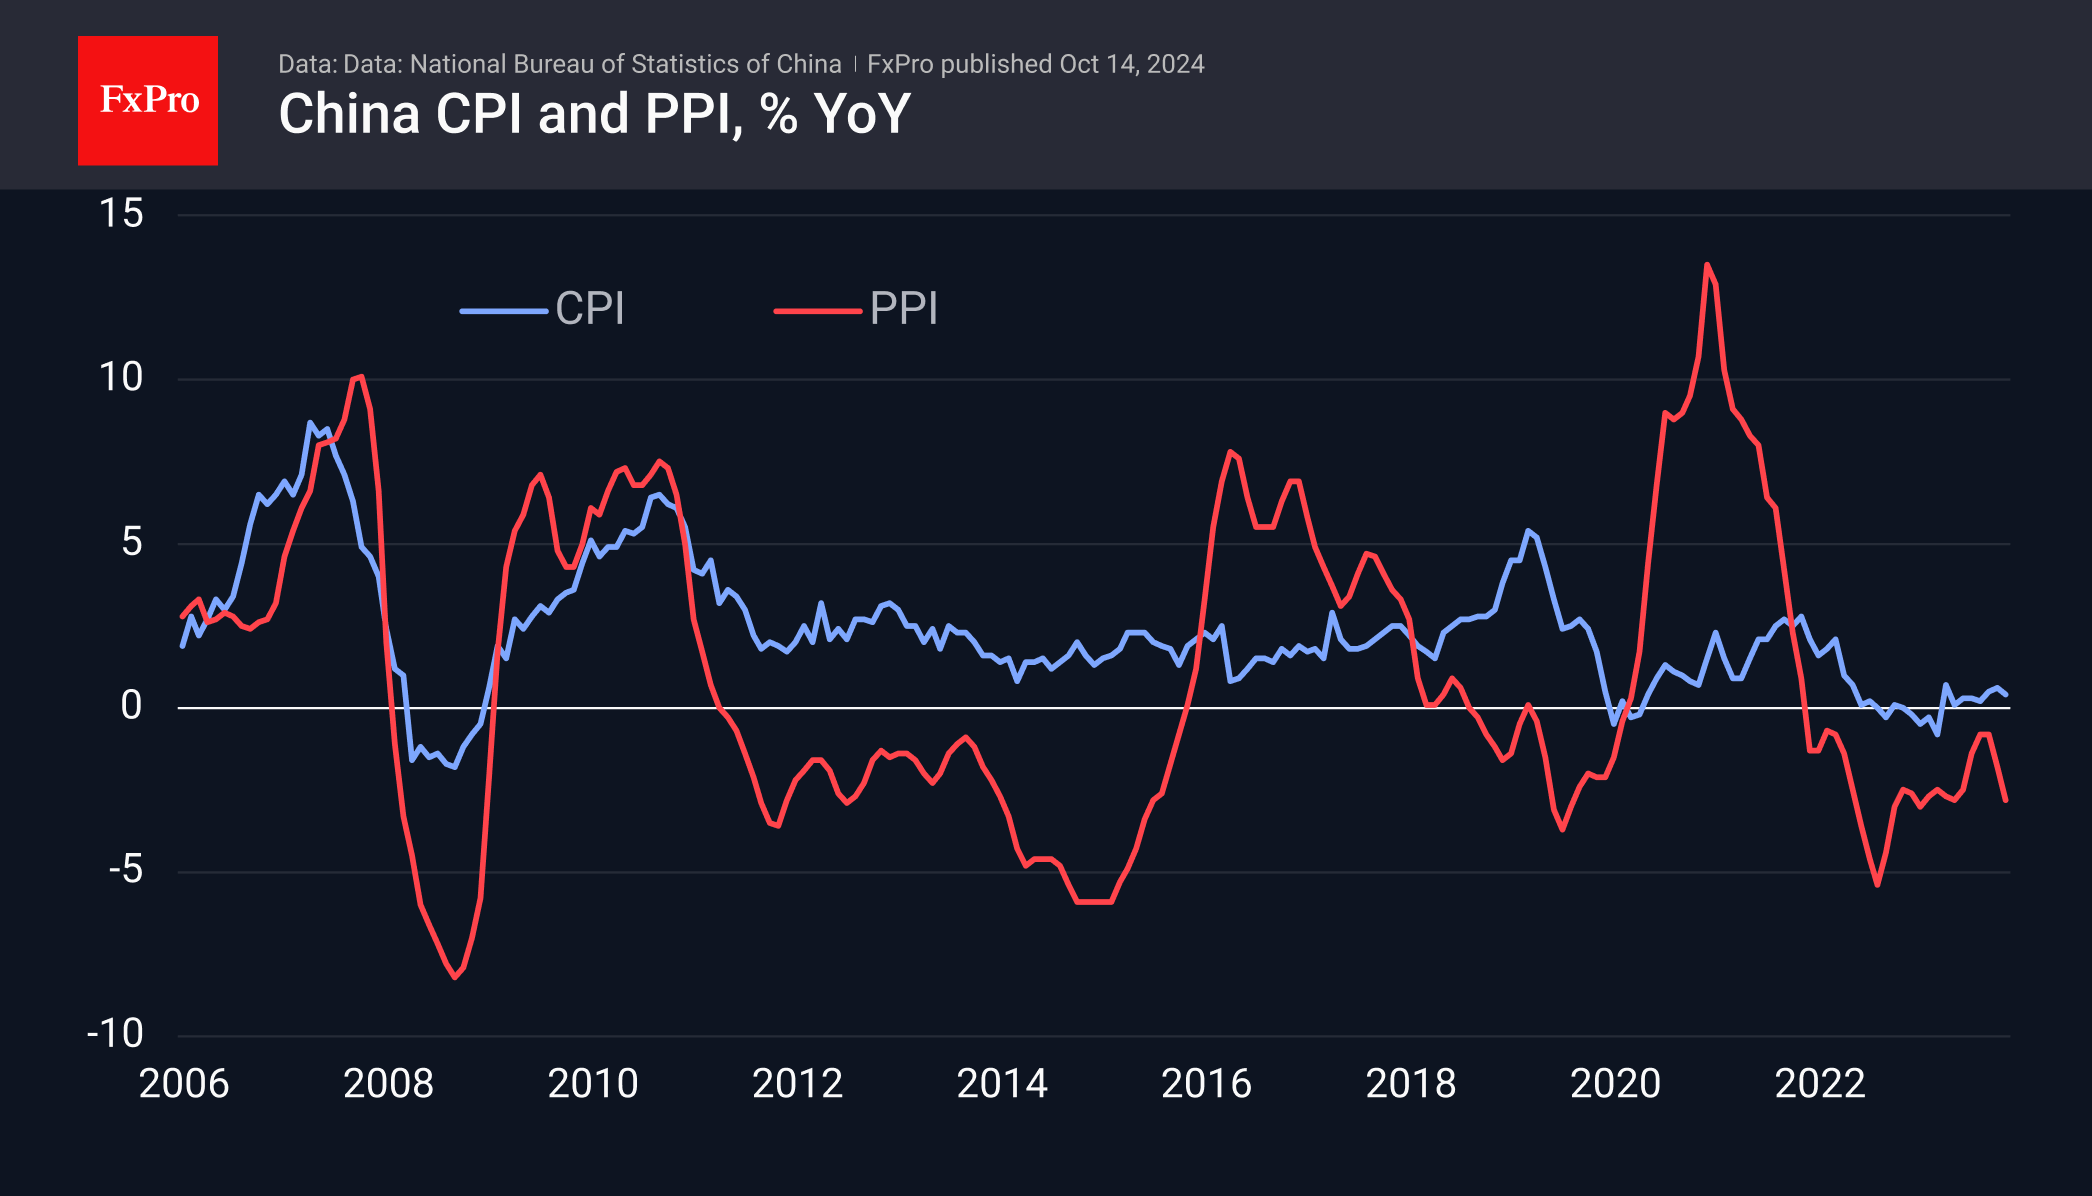
The calm in the CPI broke with the start of the trade wars, when prices spiked initially, notwithstanding the fall in producer prices. The pandemic and further isolation have pushed final prices down in China and up in the US.
Producer price dynamics suggest that this trend will continue. PPI in September was 2.8% lower than a year earlier, remaining in contractionary territory since October 2022 and accelerating losses in the last two months. The latter is a clear signal of the need to increase the economy’s stimulus.
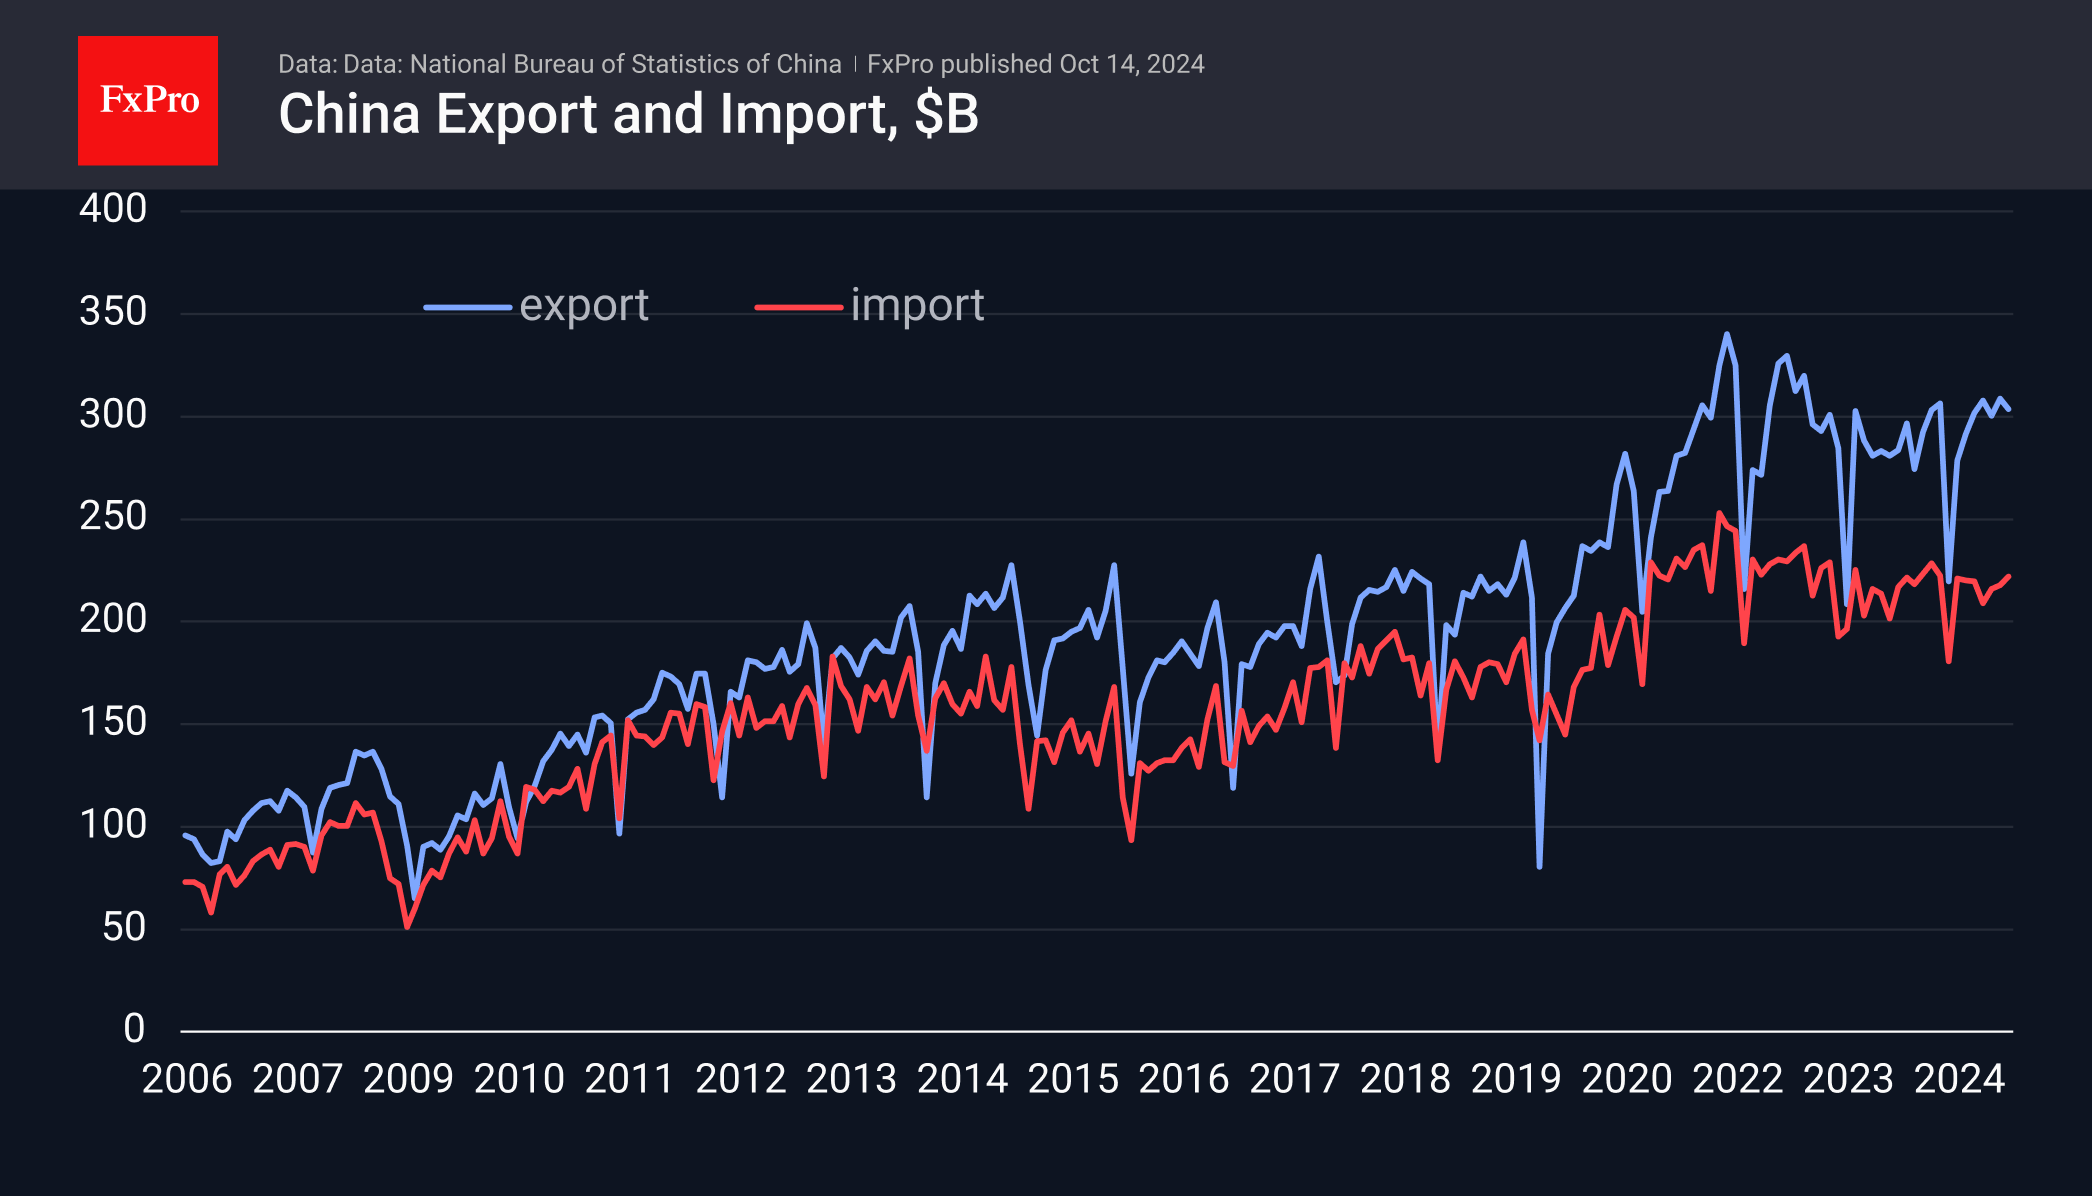
A similar conclusion can be drawn from the external trade data, where the surplus fell to $81.7bn, compared with $91.0bn a month earlier and $91.5bn expected. This is the smallest surplus since April but is the result of a rebound in imports. The trade data may be providing early signals of a recovery in Chinese economic activity. However, it will only be possible to talk about a change in market sentiment if there are reliable signs of stronger final demand in the form of retail sales or higher exports.
Monetary dynamics data released on Monday already showed that money is still flowing into the economy. The M2 growth rate stopped declining in July and reached 6.8% y/y in September.
The data is mostly negative for the Chinese currency. Weak inflation creates room for monetary or fiscal easing, while the shrinking trade surplus points to a slowdown in money inflows.
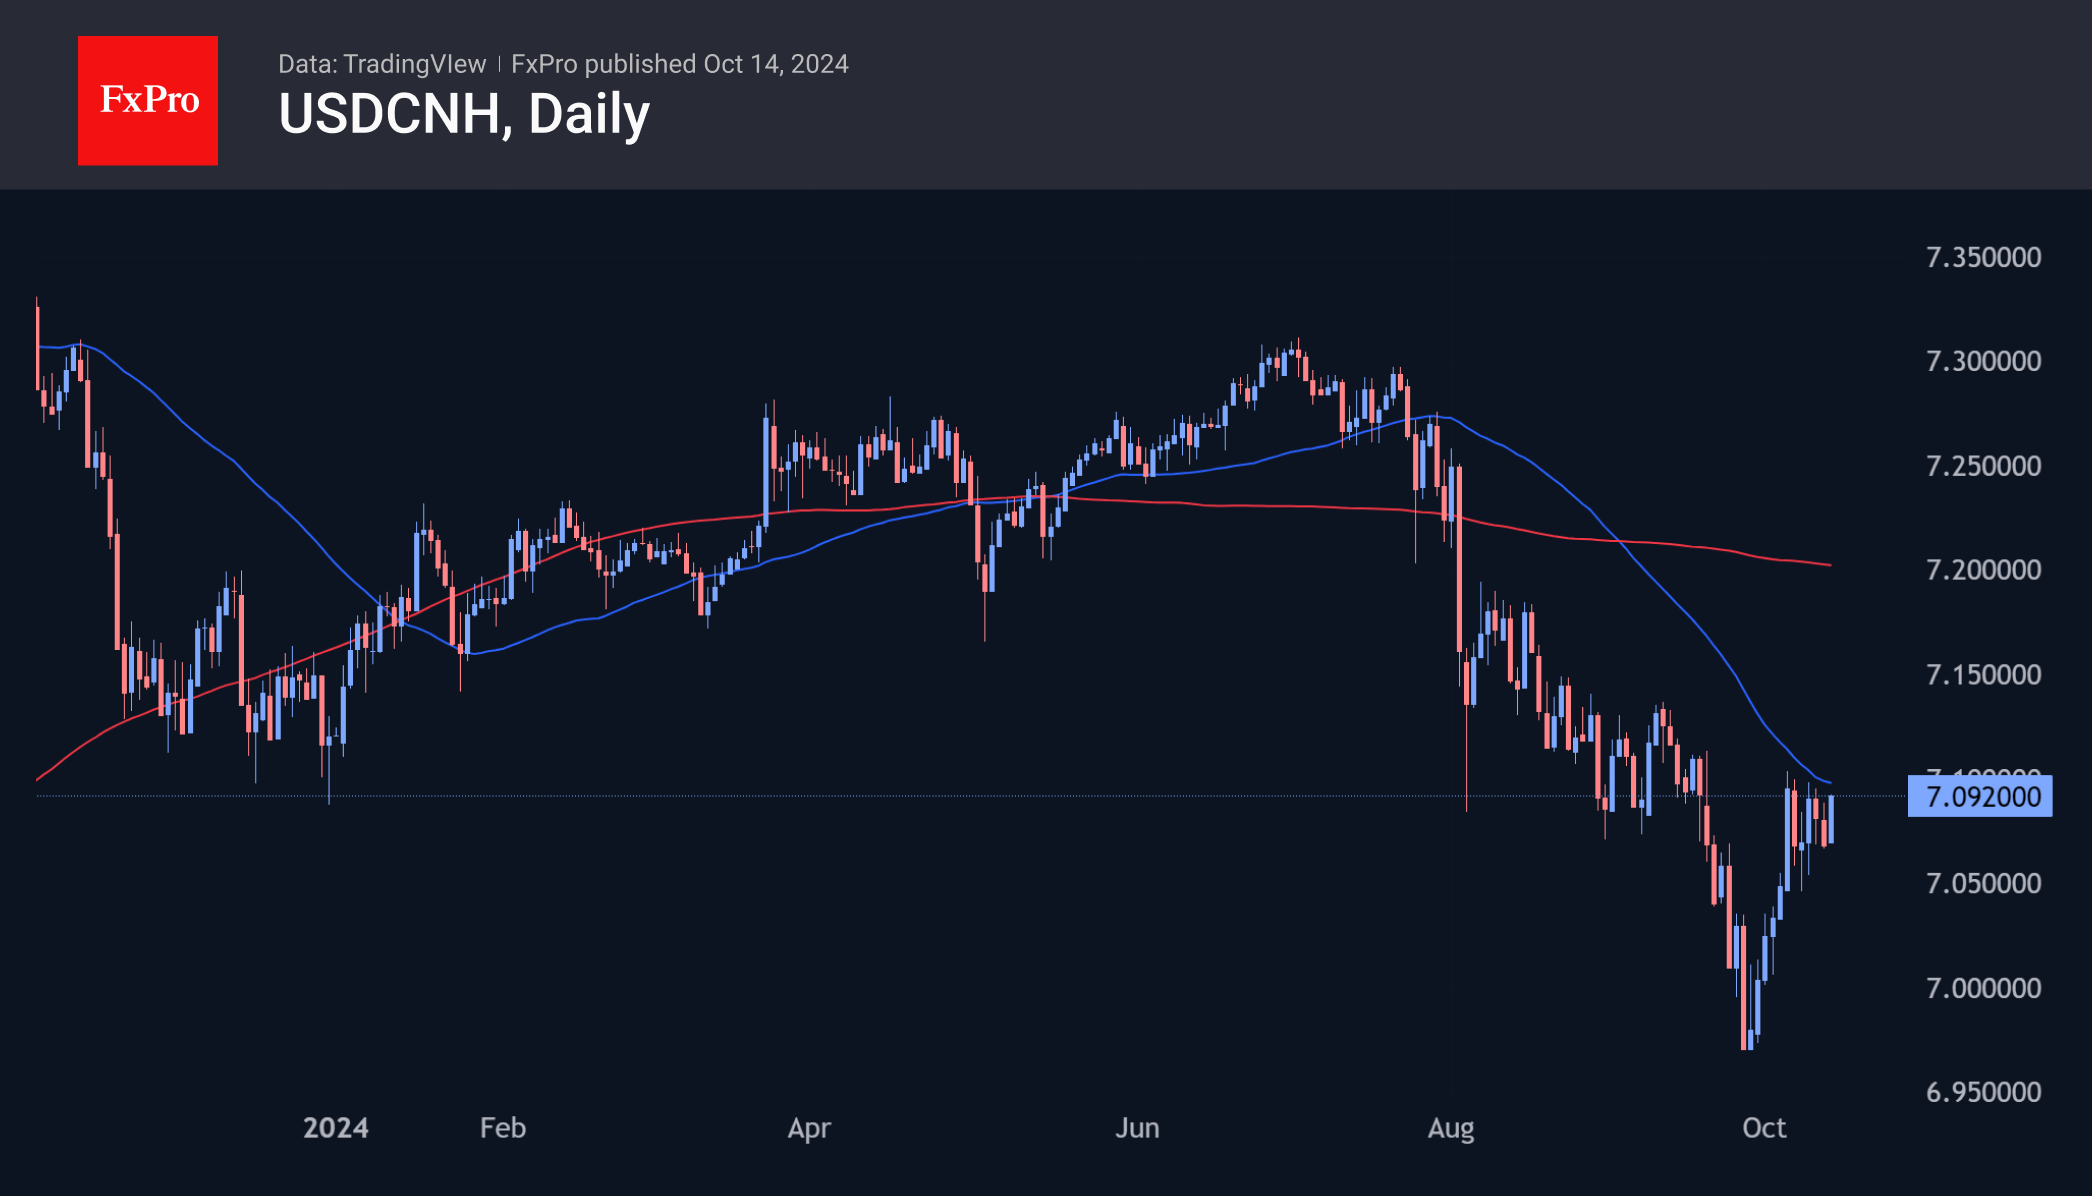
The USDCNH is trading at 7.09, up 1.75% from its late September lows—almost half the rise in the Dollar Index over the same period. Technically, the pair’s advance could accelerate as it enters the area above 7.10, close to the 50-day MA, and has few obstacles until 7.20, the next round-trip level, and the 200-day MA.
The FxPro Analyst Team