Bitcoin Volatility at 3-Month Low as Market Awaits Big Price Move
April 20, 2020 @ 21:02 +03:00
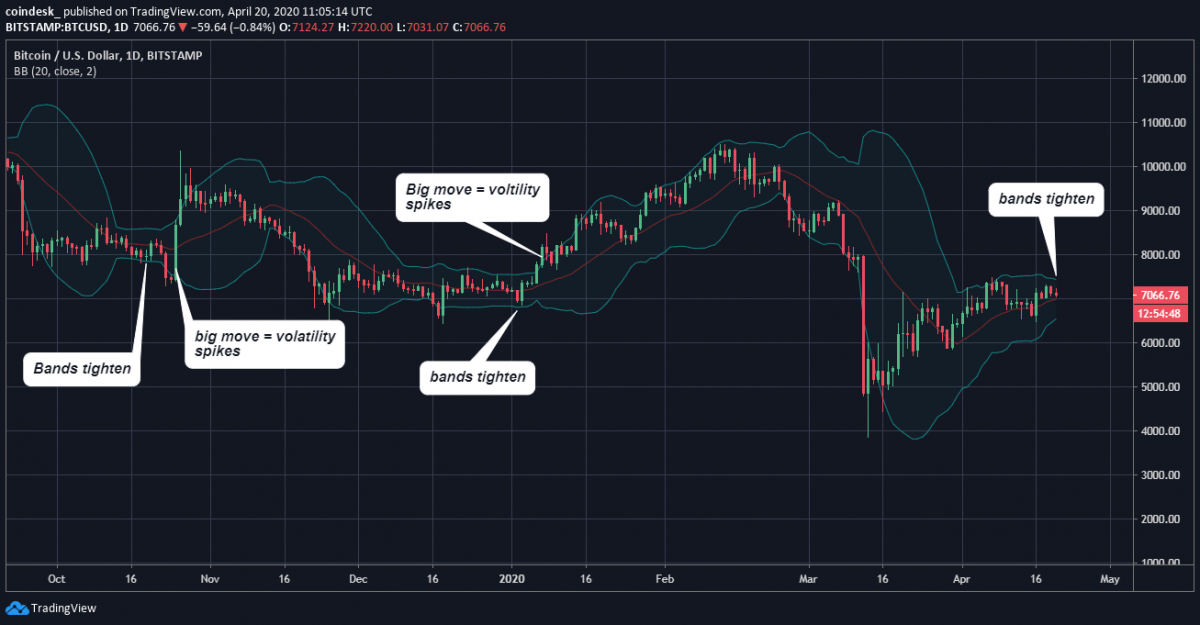
The spread between bitcoin’s Bollinger bands – volatility indicators placed two standard deviations above and below the 20-day moving price average – narrowed to $895 on Monday. That’s the lowest level since Jan. 6, when the spread was $636, according to Bitstamp data. Bitcoin has spent a better part of the last two weeks trading the range of $6,450–$7,450, with the range further narrowing to $7,000–$7,300 since Thursday.
The tightening of Bollinger Bands is widely considered to be an advanced indicator of an impending big move. “When it tightens, it is because we have been consistently trading in a narrower range for a prolonged period and we should see a breakout very soon,” said Chris Thomas, head of digital assets at Swissquote.
As can be seen, bitcoin’s price volatility has exploded following previous tight ranges in October 2019 and January 2020. Other volatility indicators have also witnessed a sharp drop over the last few weeks. For example, the Bollinger bandwidth, which is calculated by dividing the gap between the bands by the 20-day moving average, is seen at 0.13 at press time, having risen from 0.11 to 0.90 (high volatility) in the first three weeks of March.
Historically, a reading below 0.10 has marked an end of price consolidation or low-volatility environment. So with the metric currently at 0.13, we might see bitcoin trade without clear directional bias for a few more days. Meanwhile, the volatility situation in the bitcoin options market looks to have normalized, as one-month implied volatility is now hovering below its average level of 77 percent, according to data provided by crypto derivatives firm Skew.
The cryptocurrency fell by nearly 40 percent on March 12 and hit a low of $3,867 on the following day, according to CoinDesk’s Bitcoin Price Index. Meanwhile, the S&P 500, Wall Street’s benchmark index, crashed by 35 percent in the four weeks to March 24, pushing the volatility (VIX) index higher from 20 percent to 86 percent. As of Friday, the S&P was reporting over 25 percent gains from lows seen on March 24, while the VIX index was hovering around 41.
Uncertainty in both the stock and cryptocurrency markets has declined over the past couple of weeks, largely due to the Federal Reserve’s open-ended asset purchase program and the U.S. government’s massive fiscal stimulus worth trillions of dollars.
However, markets are not out of the woods yet because the number of coronavirus cases is still rising globally. The coronavirus death toll in the U.S. crossed 40,000 over the weekend with over 744,000 infections, raising doubts over the nation’s readiness to reopen its economy. Further, oil prices crashed close to a two-decade low below $16 early Monday on concerns of high inventory buildup in the U.S. As a result, equity markets could come under pressure, pushing bitcoin lower.
Put simply, the low-volatility period could end with a downside move, more so as miner-led selling pressure for bitcoin is currently high, according to crypto asset analytics company Coin Metrics. On the downside, major support is seen around $6,450, the lower end of the recent trading range.
Bitcoin Volatility at 3-Month Low as Market Awaits Big Price Move, CoinDesk, Apr 20


