


Bears kept the upper hand with Crude Oil
October 17, 2022 @ 15:11 +03:00
Three weeks ago, oil started a 22% rally due to OPEC+ production cuts and bounced back after being technically oversold. However, the 8% drop in quotations last week showed that bears still dominate this market, which several technical factors can see.
On the weekly charts, the WTI brand turned down neatly from its 50-week moving average, clearly indicating that a medium-term downtrend is prevailing here.
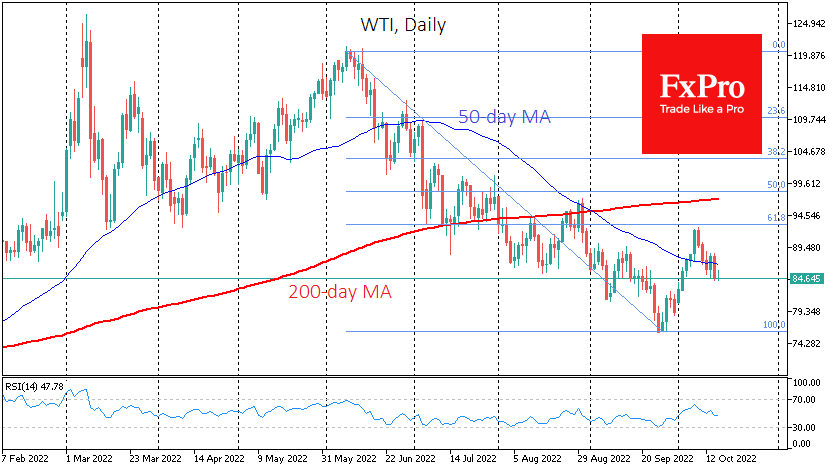
On the daily charts, oil’s rebound was well within traditional Fibonacci patterns, losing strength near the 61.8% retracement after declining from June through September. At the end of August, oil sold off spectacularly from the 200-day moving average, showing a fundamental breakdown in the market.
OPEC+ production cuts and relatively strong U.S. jobs data kept the price dynamic from becoming unidirectional, as it was in 2014-15. However, there is growing evidence that the economic slowdown suppresses energy demand, keeping long-term bearish pressure.
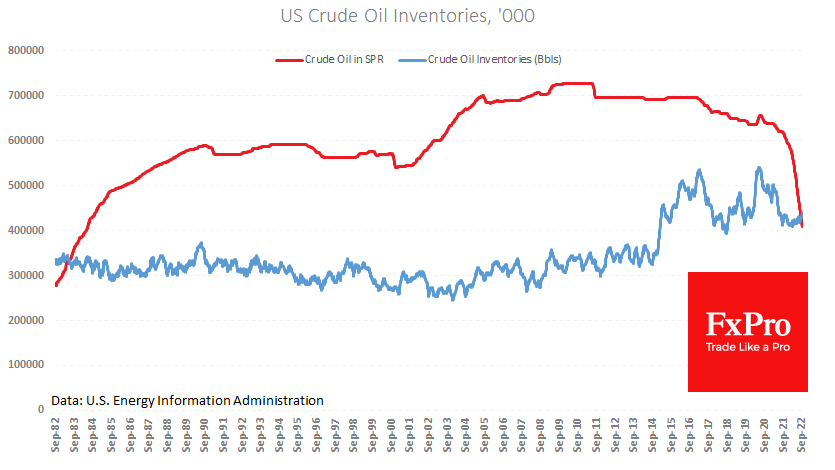
Last week, oil sellers were also encouraged by some economic news. According to the latest EIA data, oil sales from the strategic reserve have accelerated again in the past two weeks, helping lift commercial inventories by nearly 10 million.

According to Baker Hughes data released Friday night, America also increased the number of working oil rigs to 610. This is a new high from March 2020 and an attempt to get back on a rising trend.
This could mean that America will again try to take over the initiative and strengthen its lead as the world’s largest oil producer, taking advantage of a period of tight OPEC restrictions. The downtrend could intensify if we also see material moves by the U.S. administration to stimulate hydrocarbon production over the coming weeks.
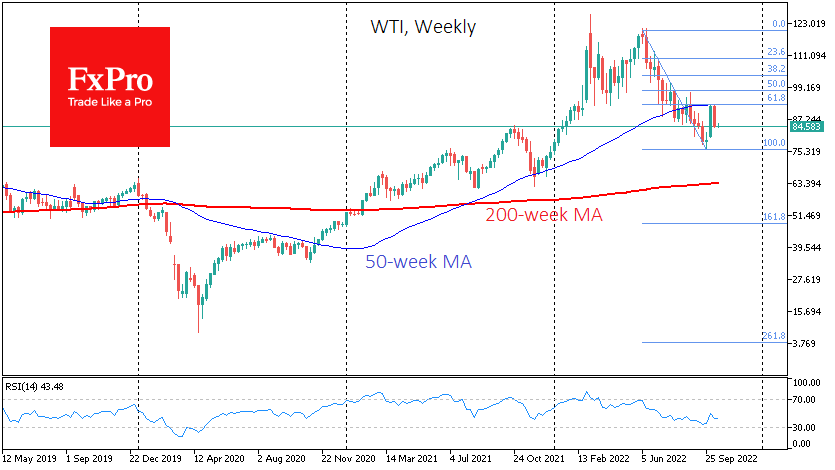
Without surprises from a surge in oil demand and new production cuts, WTI may return to the $75 area (September lows) before the end of October. Suppose that support fails, considering the global economic slowdown. In that case, the price could quickly retreat to $65 (the 200-week average) or even $50 (the psychologically important round level and the 161.8% Fibonacci area of the initial momentum from June).
The FxPro Analyst Team