Oil has lost around 8% since Monday, experiencing downward momentum at the beginning and end of the week. It ended the week below $73 per barrel Brent.

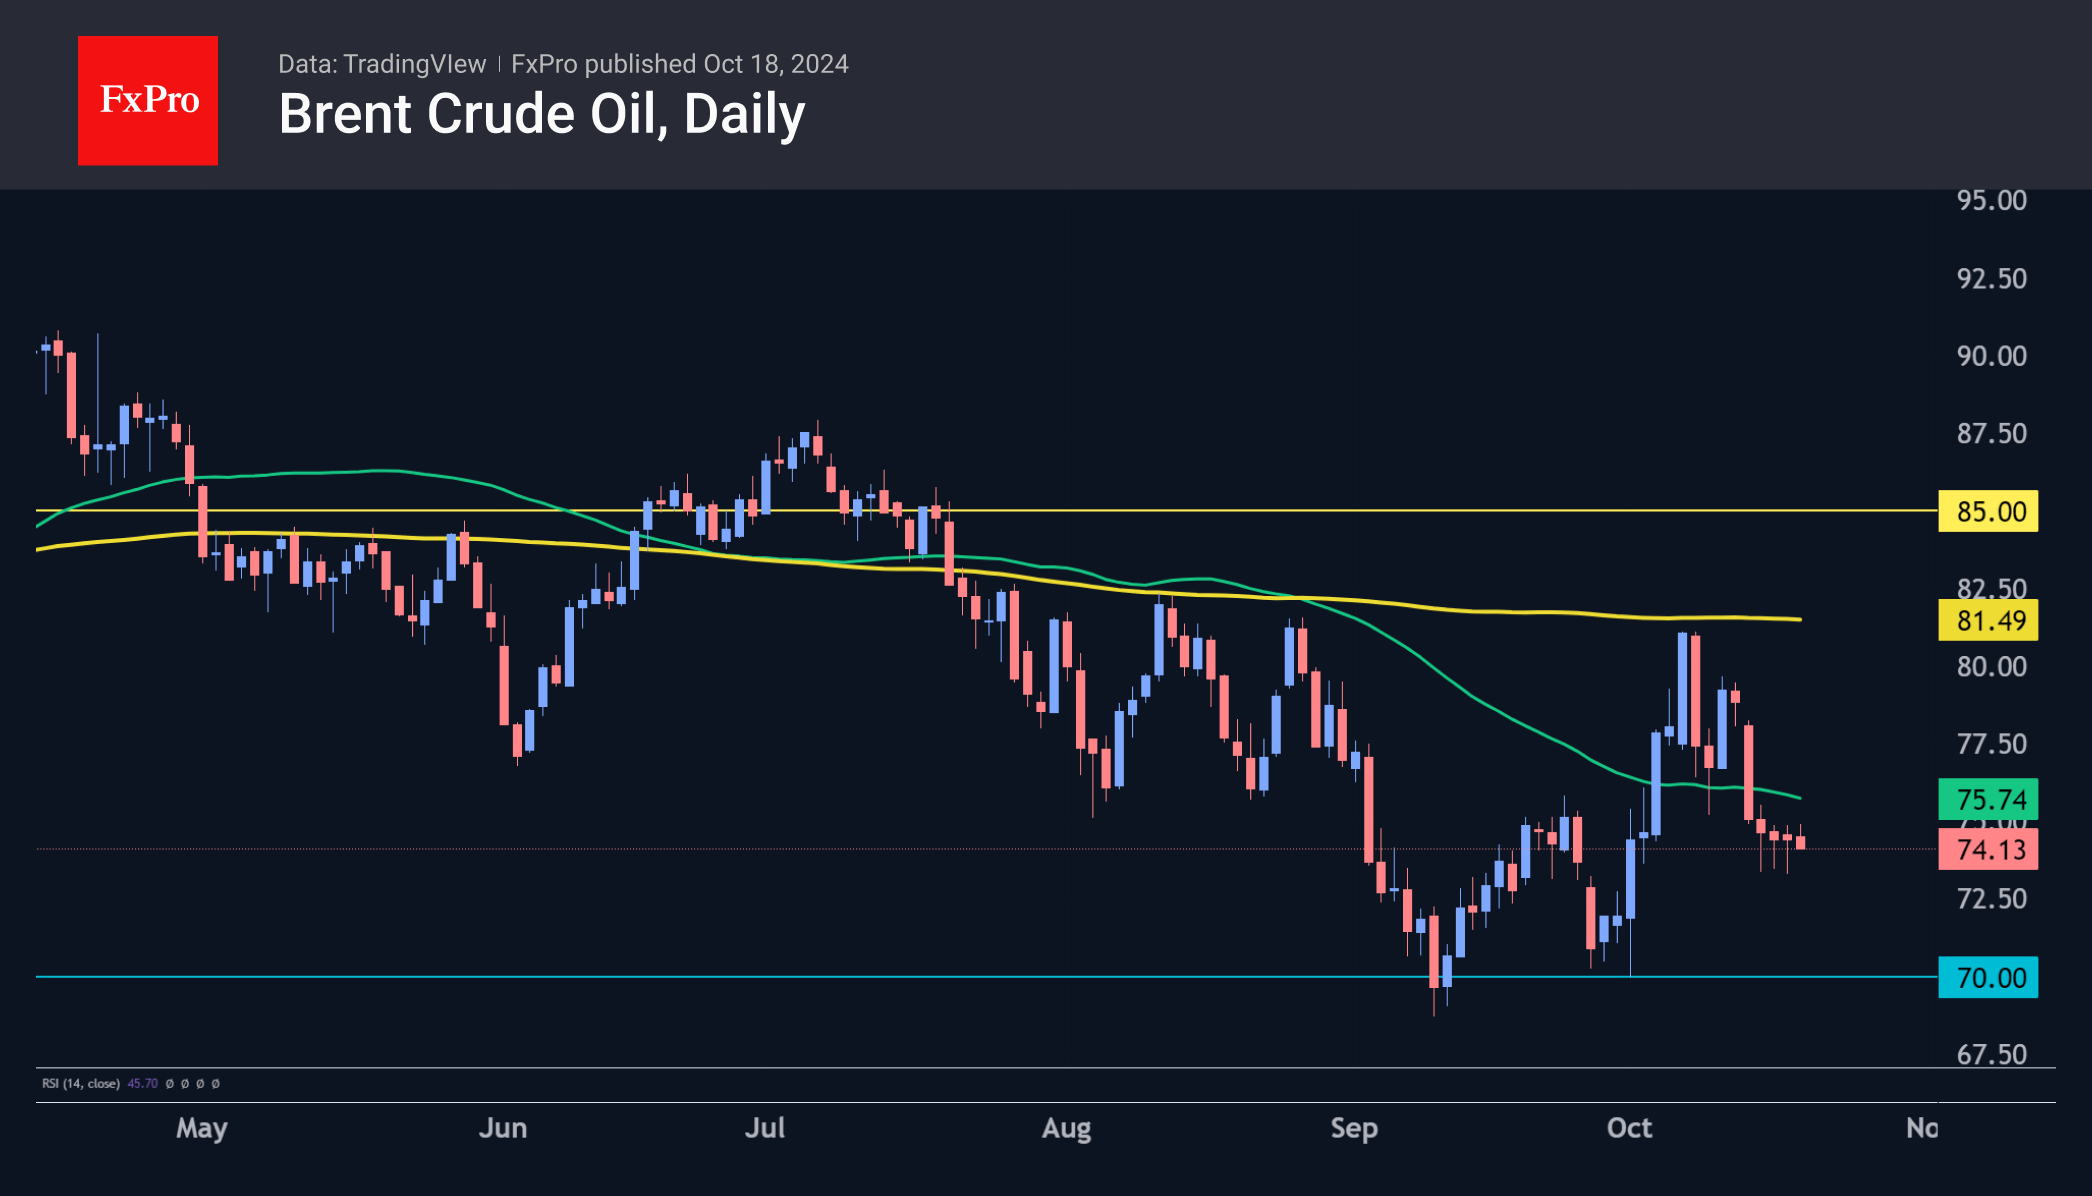
The price of oil had risen rapidly in early October. However, all bullish attempts bumped into resistance in the form of the 200-day moving average just above $81.20 a barrel, and in the outgoing week, the price rolled back below the 50-day moving average at $75.7.
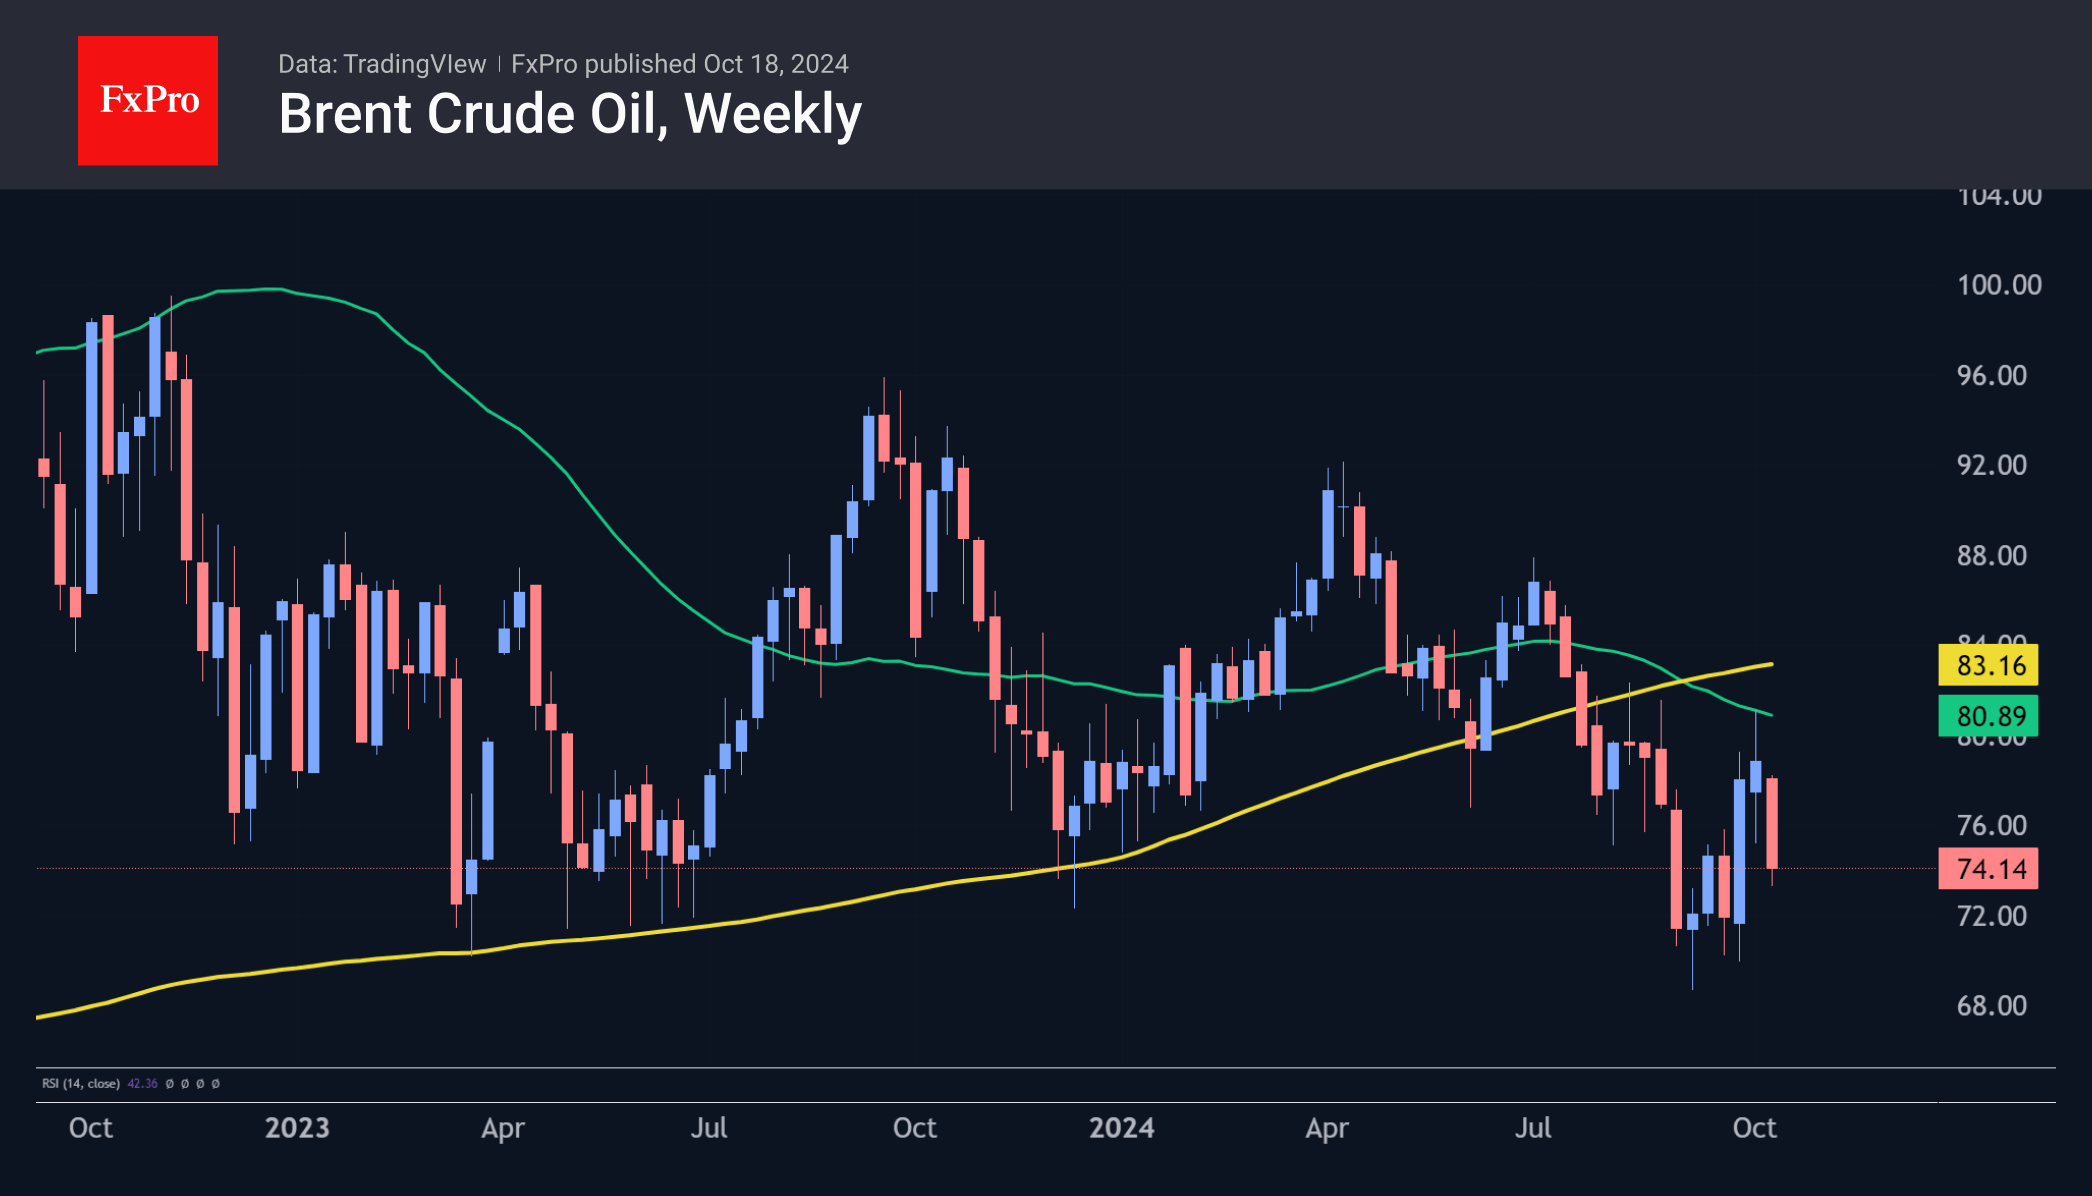
The weekly picture is even bleaker, with the price below its 50- and 200-week moving averages. This is a bearish sign, reinforced by a death cross—a drop in the 50-week average below the 200-week average.
Sellers in oil took the lead on reports that the US is strongly discouraging Israel from attacking Iran’s oil facilities. This is an important signal that the US is playing on the bearish side now.
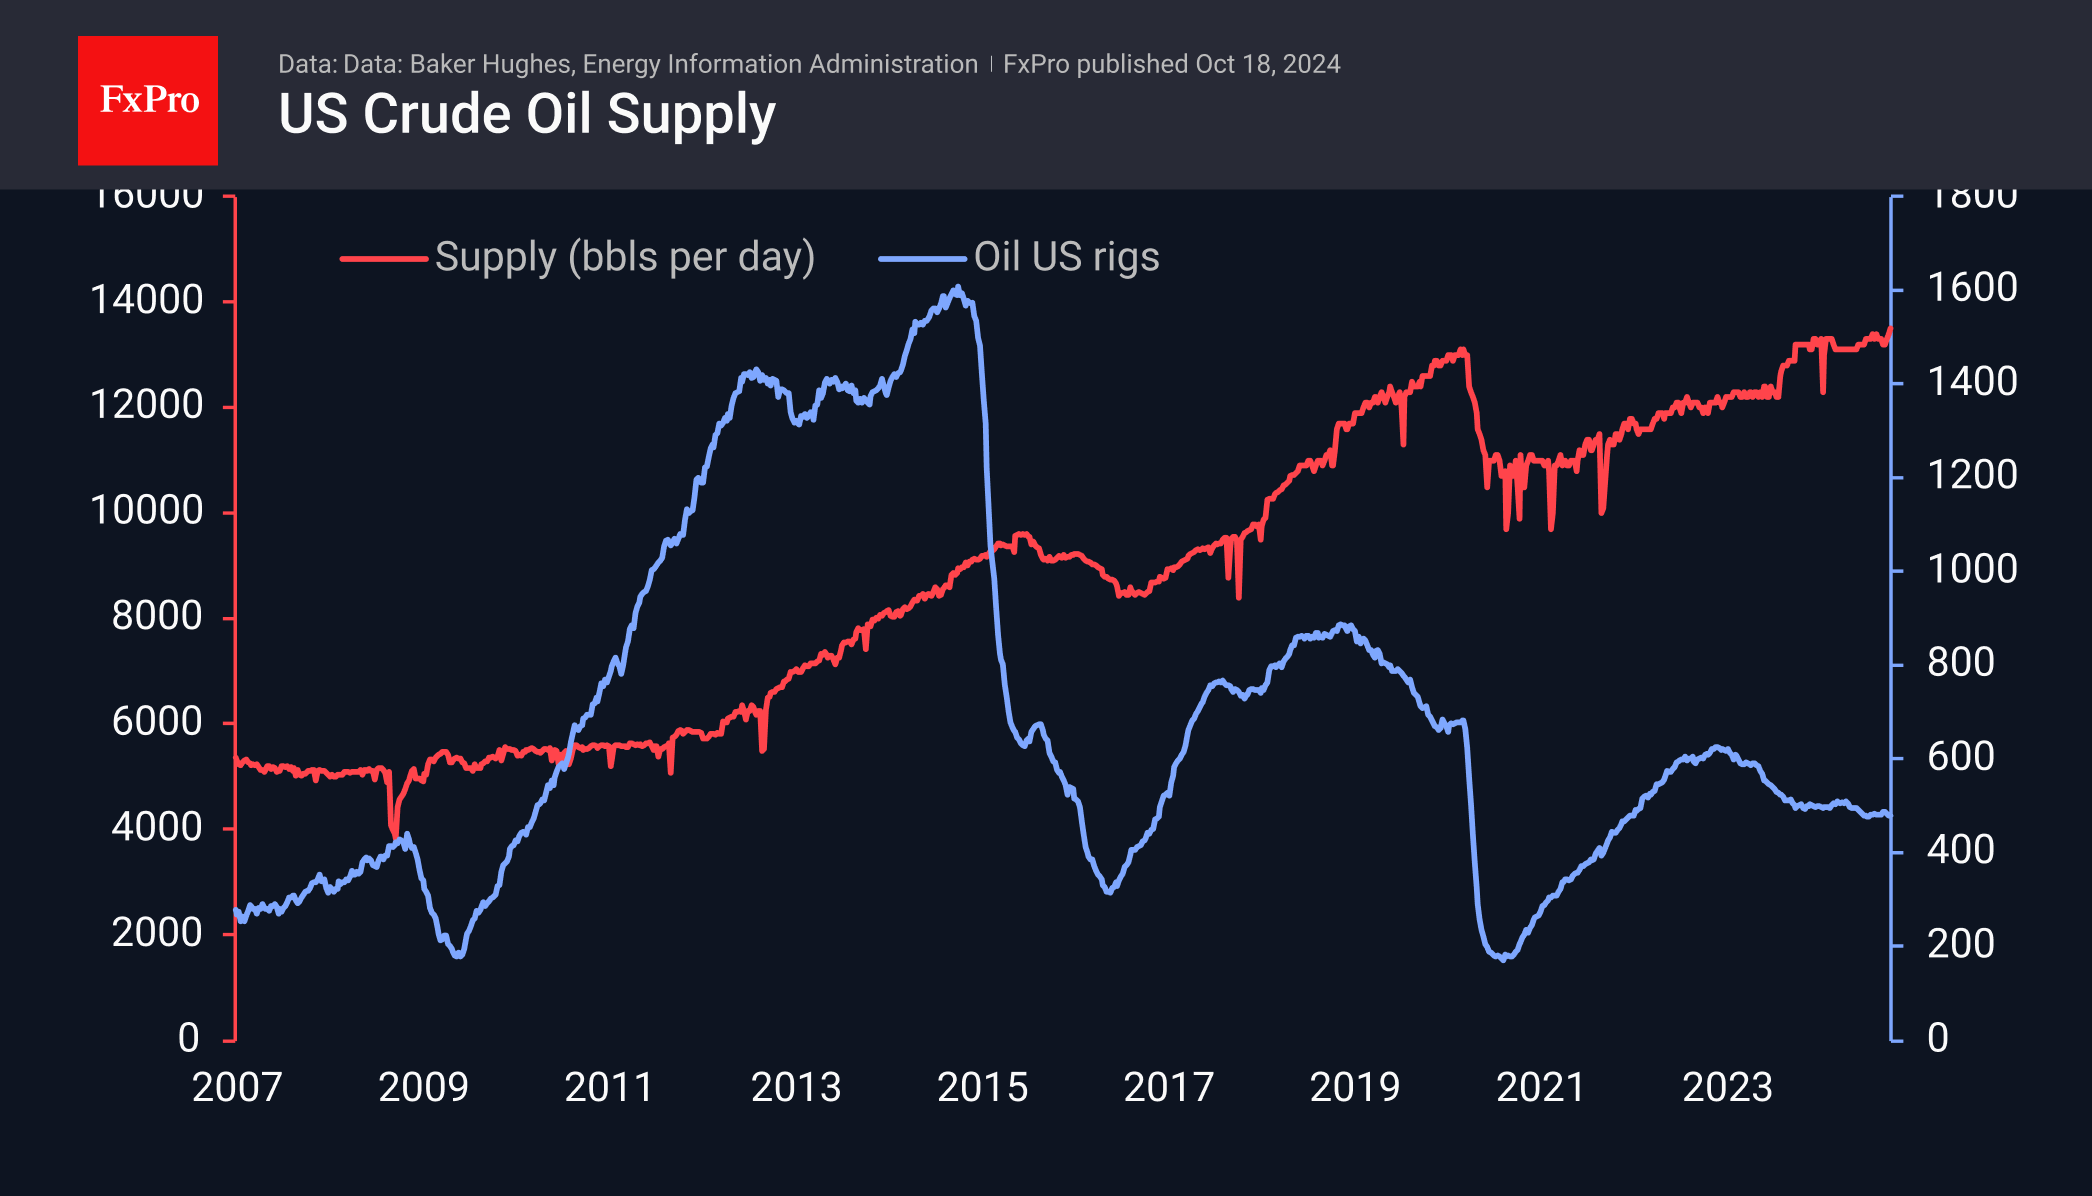
Among the longer-term factors, we highlight a new production record of 13.5 million barrels per day in the US, a slight increase in drilling activity, and a less severe impact from Hurricane Milton than originally estimated.
In addition, OPEC is lowering its estimates for oil demand growth.
The FxPro Analyst Team