World markets did not manage to find enough buyers on Thursday to return to growth. Most indices were again under pressure by the end of the day, which remains in force on Friday morning. Futures on US indices are losing 2% so far today.
Although the S&P 500 is a broader and more representative market index, we should not ignore the signals and impact of the oldest US market index. The Dow Jones, which has a lower representation of high tech stocks, fell to a low of 26100 in July and is again testing the 200-day average as it did back then.

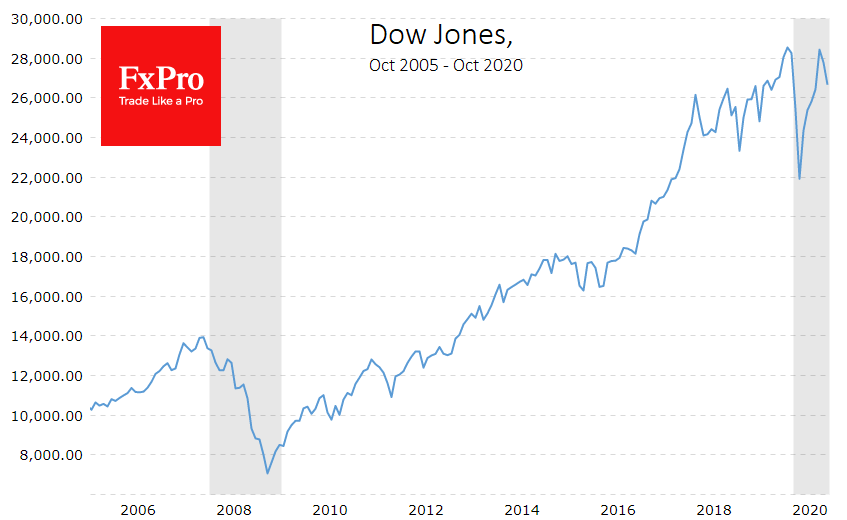
The shorter 50-day average was taken by bears earlier this month, after which pressure on it increased. The 200-day line is an essential mid-term indicator of the market cycle that major institutional players are focusing on. A confident closing on Friday below this level at 26,000 may be a signal of a fundamental reversal of the trend.
Some players are already starting to look at buying after the downturn but as the dynamics of yesterday showed, the optimism of participants is extremely volatile. Sales were increasing just before the session close when professional traders dominated the markets.
Pressure on the markets was caused by record numbers of new infections and worsening corporate reports. However, equally important in our view, is the lack of consensus on a support package from legislators who continue to build debt.
The latter causes us to look for analogies in history, not the Spanish flu of 1919-1920, but events that occurred a decade later. America was loaded with high debt at the time, however, markets were growing at the expense of private investor activity and the previous economic boom. In the spring of 2020, Dow Jones fell as rapidly as it did in 1929-1930. This time, however, it managed to recover almost completely thanks to unprecedented monetary policy measures, as well as government checks for households.

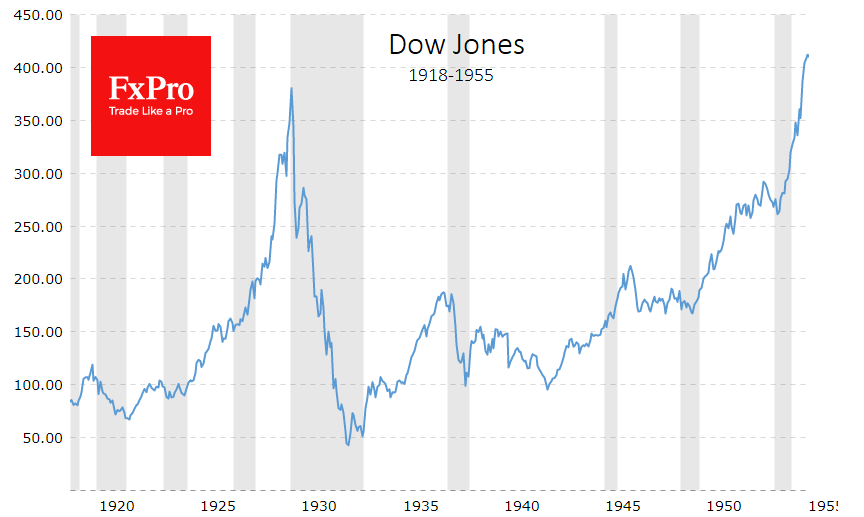
However, there is a risk that, as in the 1930s, this was nothing more than an impulse spike followed by many years of a market downturn. Ninety years ago, the Dow Jones fell almost three years in a row. The periods were slightly shorter, from 2000 to 2002 and from 2007 to 2009. Now the peaks of February should be considered the starting point, but this means that there are still many months of systematic market decline ahead.
The FxPro Analyst Team